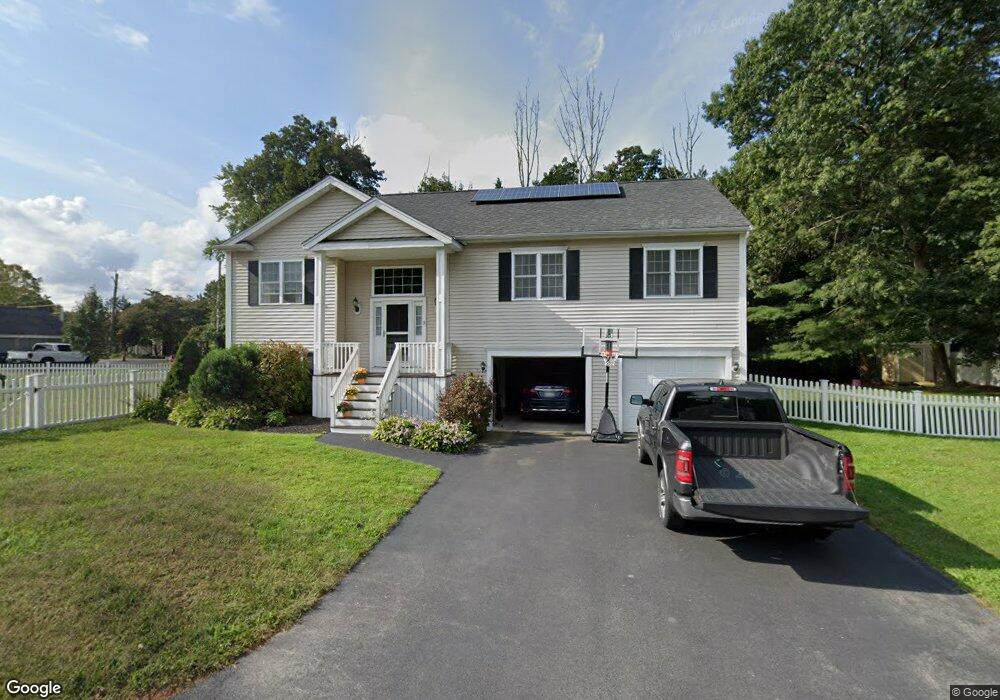
3 Ture Ln Holbrook, MA 02343
Estimated Value: $697,000 - $776,000
3
Beds
2
Baths
1,514
Sq Ft
$490/Sq Ft
Est. Value
About This Home
This home is located at 3 Ture Ln, Holbrook, MA 02343 and is currently estimated at $742,278, approximately $490 per square foot. 3 Ture Ln is a home located in Norfolk County with nearby schools including John F. Kennedy Elementary School, Holbrook Middle High School, and St. Casimir School.
Ownership History
Date
Name
Owned For
Owner Type
Purchase Details
Closed on
Oct 12, 2012
Sold by
Spearin
Bought by
Kenny Gerald J and Santos Sandy M
Current Estimated Value
Purchase Details
Closed on
Sep 10, 2010
Sold by
Aspinwall Corp
Bought by
Santos Sandy M and Kenny Gerald J
Home Financials for this Owner
Home Financials are based on the most recent Mortgage that was taken out on this home.
Original Mortgage
$315,748
Interest Rate
4.55%
Mortgage Type
Purchase Money Mortgage
Purchase Details
Closed on
Feb 12, 2010
Sold by
Blackburn Elizabeth and Mack Nancy
Bought by
Aspinwall Corp
Home Financials for this Owner
Home Financials are based on the most recent Mortgage that was taken out on this home.
Original Mortgage
$246,100
Interest Rate
5.12%
Mortgage Type
Purchase Money Mortgage
Create a Home Valuation Report for This Property
The Home Valuation Report is an in-depth analysis detailing your home's value as well as a comparison with similar homes in the area
Home Values in the Area
Average Home Value in this Area
Purchase History
| Date | Buyer | Sale Price | Title Company |
|---|---|---|---|
| Kenny Gerald J | -- | -- | |
| Kenny Gerald J | -- | -- | |
| Kenny Gerald J | -- | -- | |
| Santos Sandy M | $325,000 | -- | |
| Santos Sandy M | $325,000 | -- | |
| Santos Sandy M | $325,000 | -- | |
| Aspinwall Corp | $115,000 | -- | |
| Aspinwall Corp | $115,000 | -- | |
| Aspinwall Corp | $115,000 | -- |
Source: Public Records
Mortgage History
| Date | Status | Borrower | Loan Amount |
|---|---|---|---|
| Previous Owner | Santos Sandy M | $315,748 | |
| Previous Owner | Aspinwall Corp | $246,100 |
Source: Public Records
Tax History Compared to Growth
Tax History
| Year | Tax Paid | Tax Assessment Tax Assessment Total Assessment is a certain percentage of the fair market value that is determined by local assessors to be the total taxable value of land and additions on the property. | Land | Improvement |
|---|---|---|---|---|
| 2025 | $86 | $654,800 | $248,500 | $406,300 |
| 2024 | $7,979 | $593,700 | $212,500 | $381,200 |
| 2023 | $8,674 | $564,000 | $205,400 | $358,600 |
| 2022 | $8,199 | $497,200 | $178,700 | $318,500 |
| 2021 | $8,057 | $467,900 | $167,000 | $300,900 |
| 2020 | $8,368 | $455,500 | $162,100 | $293,400 |
| 2019 | $7,990 | $410,600 | $136,100 | $274,500 |
| 2018 | $8,198 | $396,600 | $132,100 | $264,500 |
| 2017 | $7,637 | $365,400 | $132,100 | $233,300 |
| 2016 | $6,636 | $337,900 | $109,300 | $228,600 |
| 2015 | $6,190 | $324,400 | $105,100 | $219,300 |
| 2014 | $5,914 | $315,100 | $105,100 | $210,000 |
Source: Public Records
Map
Nearby Homes
- 12 Hamilton Way
- 38 Stephen Dr
- 5 Brookville Ave
- 279 Howard St
- 261 Jon Dr
- 18 Brookfield Dr
- 285 Hovendon Ave
- 60 Bonney St
- 105 Oscar Ave
- 68 Spring St
- 170 Elsie Rd
- 25 Merritt Ave
- 61 Kent St
- 719 S Franklin St Unit L Block 1
- 719 S Franklin St Unit D Block 1
- 719 S Franklin St Unit C Block 1
- 2 Glendower St
- 690 N Quincy St
- 11 Winsten St
- 200 Sawtell Ave
- 2 Ture Ln
- 0 Ture Ln
- 1090 S Franklin St
- 1116 S Franklin St
- 7 Howard Ave
- 1124 S Franklin St
- 9 Howard Ave
- 1088 S Franklin St
- 1097 S Franklin St
- 21 Howard Ave
- 19 Howard Ave
- 1126 S Franklin St
- 27 Hamilton Way
- 1091 S Franklin St
- 539 Howard St
- 8 Howard Ave
- 1086 S Franklin St
- 529 Howard St
- 3 Howard Ave
- 1077 S Franklin St