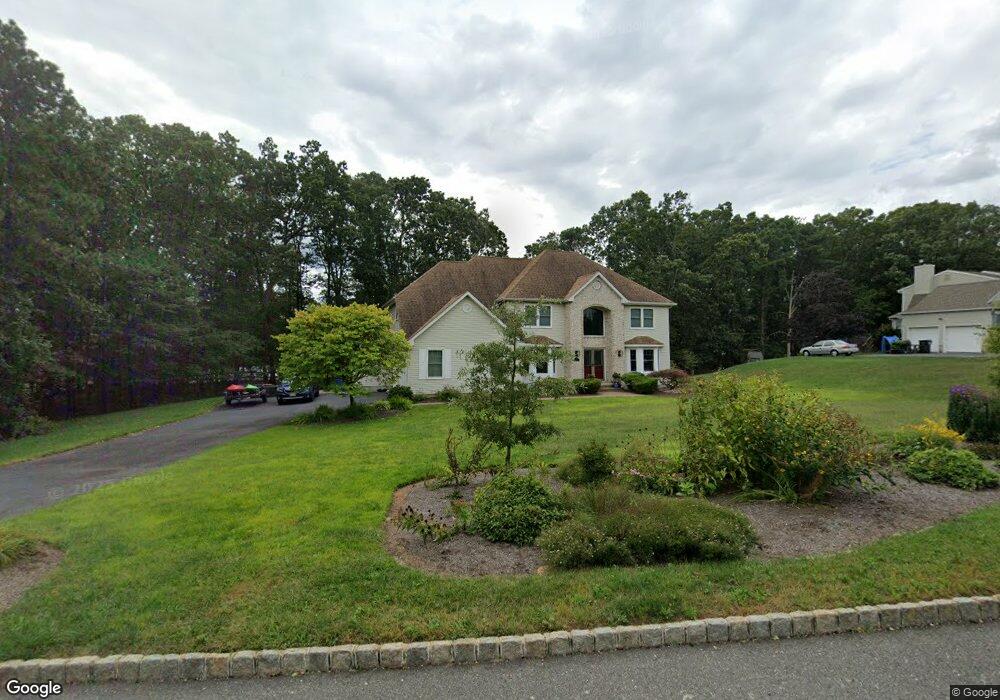
3 Twin Hill Ct Howell, NJ 07731
Land of Pines NeighborhoodEstimated Value: $838,724 - $1,108,000
4
Beds
2
Baths
2,772
Sq Ft
$338/Sq Ft
Est. Value
About This Home
This home is located at 3 Twin Hill Ct, Howell, NJ 07731 and is currently estimated at $938,181, approximately $338 per square foot. 3 Twin Hill Ct is a home located in Monmouth County with nearby schools including Land O' Pines School, Newbury School, and Howell Middle School North.
Ownership History
Date
Name
Owned For
Owner Type
Purchase Details
Closed on
Jul 1, 2010
Sold by
Niolu Steven and Niolu Joan
Bought by
Moss John and Moss Geralyn
Current Estimated Value
Home Financials for this Owner
Home Financials are based on the most recent Mortgage that was taken out on this home.
Original Mortgage
$315,000
Interest Rate
4.57%
Mortgage Type
New Conventional
Purchase Details
Closed on
Sep 18, 1997
Sold by
Friendship Builders
Bought by
Niolu Steven and Niolu Joan
Home Financials for this Owner
Home Financials are based on the most recent Mortgage that was taken out on this home.
Original Mortgage
$135,000
Interest Rate
7.41%
Create a Home Valuation Report for This Property
The Home Valuation Report is an in-depth analysis detailing your home's value as well as a comparison with similar homes in the area
Home Values in the Area
Average Home Value in this Area
Purchase History
| Date | Buyer | Sale Price | Title Company |
|---|---|---|---|
| Moss John | $483,000 | Consolidated Title Group Llc | |
| Niolu Steven | $250,000 | -- |
Source: Public Records
Mortgage History
| Date | Status | Borrower | Loan Amount |
|---|---|---|---|
| Previous Owner | Moss John | $315,000 | |
| Previous Owner | Niolu Steven | $135,000 |
Source: Public Records
Tax History Compared to Growth
Tax History
| Year | Tax Paid | Tax Assessment Tax Assessment Total Assessment is a certain percentage of the fair market value that is determined by local assessors to be the total taxable value of land and additions on the property. | Land | Improvement |
|---|---|---|---|---|
| 2025 | $11,566 | $685,100 | $221,000 | $464,100 |
| 2024 | $11,470 | $651,600 | $196,000 | $455,600 |
| 2023 | $11,470 | $616,000 | $171,000 | $445,000 |
| 2022 | $12,343 | $584,700 | $161,000 | $423,700 |
| 2021 | $12,343 | $537,800 | $161,000 | $376,800 |
| 2020 | $13,020 | $560,000 | $161,000 | $399,000 |
| 2019 | $13,168 | $555,600 | $161,000 | $394,600 |
| 2018 | $12,896 | $541,600 | $161,000 | $380,600 |
| 2017 | $13,170 | $546,700 | $165,000 | $381,700 |
| 2016 | $12,217 | $500,500 | $170,000 | $330,500 |
| 2015 | $12,125 | $491,900 | $166,000 | $325,900 |
| 2014 | $12,026 | $452,600 | $181,000 | $271,600 |
Source: Public Records
Map
Nearby Homes
- 1 Sun Hollow Rd
- 43 Darien Rd
- 3 Diamond Ln
- 21 Christopher Dr
- 254 Aldrich Rd
- 53 Darien Rd
- 52 Darien Rd
- 24 Sun Hollow Rd
- 66 Diamond Ln
- 2 Lyndon Ln
- 22 Diamond Ln
- 4 Christopher Dr
- 4 Rainbow Dr
- 324 Aldrich Rd
- 0 Windeler Rd Unit 22523932
- 44 Diamond Ln
- 9 Yellowstone Ln
- 138 Windeler Rd
- 47 Yellowstone Ln
- 131 Starlight Rd