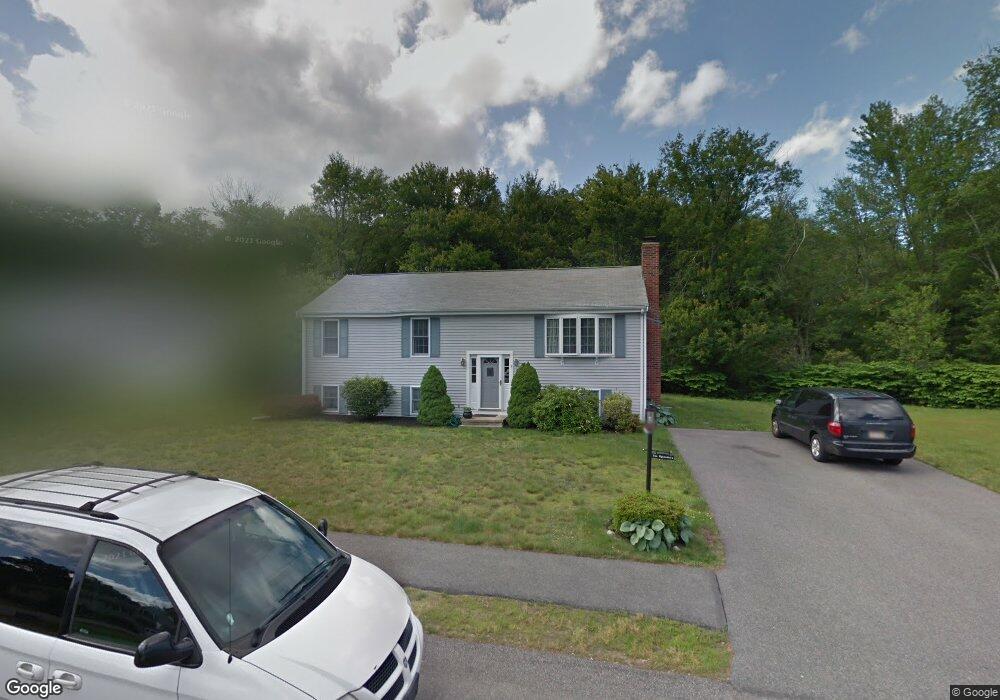
3 Valley Rd Whitman, MA 02382
Estimated Value: $519,000 - $648,973
3
Beds
4
Baths
1,584
Sq Ft
$373/Sq Ft
Est. Value
About This Home
This home is located at 3 Valley Rd, Whitman, MA 02382 and is currently estimated at $591,493, approximately $373 per square foot. 3 Valley Rd is a home located in Plymouth County with nearby schools including St Bridget School.
Ownership History
Date
Name
Owned For
Owner Type
Purchase Details
Closed on
Nov 21, 2022
Sold by
Hylander Mark R and Hylander Deborah J
Bought by
Hylander Ft and Hylander
Current Estimated Value
Purchase Details
Closed on
Sep 23, 1999
Sold by
Ac Rt
Bought by
Hylander Deborah J and Hylander Mark R
Create a Home Valuation Report for This Property
The Home Valuation Report is an in-depth analysis detailing your home's value as well as a comparison with similar homes in the area
Home Values in the Area
Average Home Value in this Area
Purchase History
| Date | Buyer | Sale Price | Title Company |
|---|---|---|---|
| Hylander Ft | -- | None Available | |
| Hylander Ft | -- | None Available | |
| Hylander Deborah J | $75,000 | -- | |
| Hylander Deborah J | $75,000 | -- |
Source: Public Records
Mortgage History
| Date | Status | Borrower | Loan Amount |
|---|---|---|---|
| Previous Owner | Hylander Deborah J | $213,675 | |
| Previous Owner | Hylander Deborah J | $178,000 | |
| Previous Owner | Hylander Deborah J | $185,000 | |
| Previous Owner | Hylander Deborah J | $181,500 |
Source: Public Records
Tax History Compared to Growth
Tax History
| Year | Tax Paid | Tax Assessment Tax Assessment Total Assessment is a certain percentage of the fair market value that is determined by local assessors to be the total taxable value of land and additions on the property. | Land | Improvement |
|---|---|---|---|---|
| 2025 | $7,848 | $598,200 | $259,100 | $339,100 |
| 2024 | $6,971 | $547,200 | $254,400 | $292,800 |
| 2023 | $6,391 | $471,000 | $221,800 | $249,200 |
| 2022 | $6,146 | $422,100 | $201,500 | $220,600 |
| 2021 | $6,166 | $397,800 | $177,900 | $219,900 |
| 2020 | $5,969 | $376,600 | $168,900 | $207,700 |
| 2019 | $5,729 | $372,500 | $168,900 | $203,600 |
| 2018 | $5,181 | $341,100 | $155,400 | $185,700 |
| 2017 | $5,144 | $341,100 | $155,400 | $185,700 |
| 2016 | $4,998 | $320,600 | $149,800 | $170,800 |
| 2015 | $4,873 | $312,200 | $149,800 | $162,400 |
Source: Public Records
Map
Nearby Homes
- 63 Dewey Ave
- 110 South Ave Unit 14
- 110 South Ave
- 53 Temple St
- 164 Warren Ave
- 135-137 Temple St
- 532 Washington St
- 48 Day St
- 1098 Bedford St
- 20 Elm Place
- 54-56 Stetson St
- 608 Plymouth St
- 40 Lazel St
- 66 Belmont St
- 604 Bedford St Unit 5
- 170 Pleasant St
- 23 Reed Place
- 300 High St
- 277 School St
- 150 Harvard St