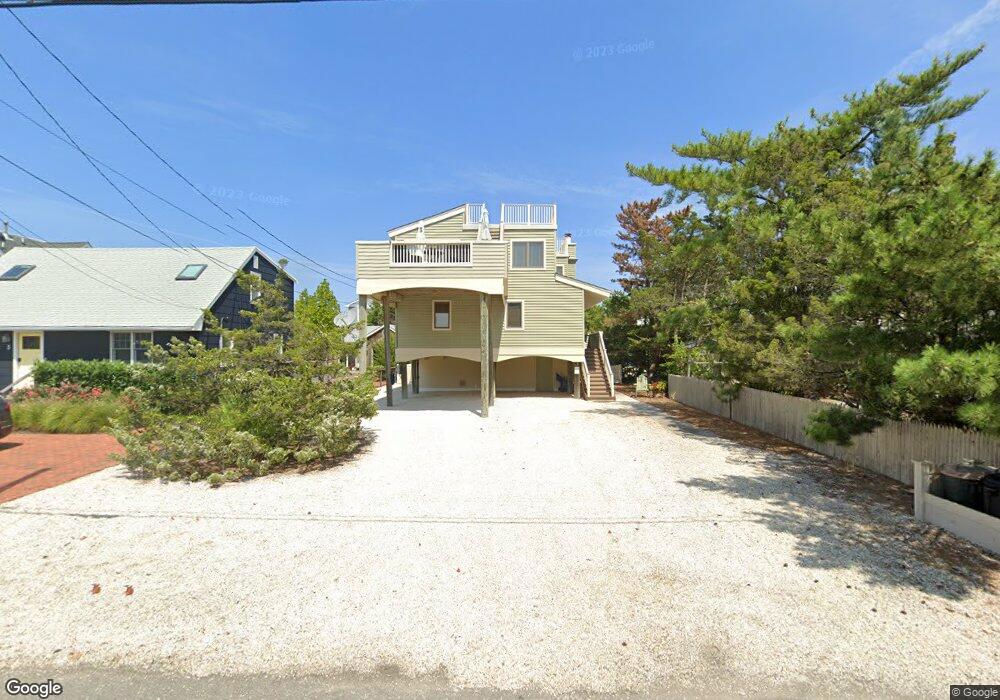
3 W 21st St Barnegat Light, NJ 08006
Long Beach Island NeighborhoodEstimated Value: $1,436,730 - $1,689,000
4
Beds
4
Baths
1,768
Sq Ft
$880/Sq Ft
Est. Value
About This Home
This home is located at 3 W 21st St, Barnegat Light, NJ 08006 and is currently estimated at $1,556,183, approximately $880 per square foot. 3 W 21st St is a home with nearby schools including Ethel A. Jacobsen Elementary School, Long Beach Island Grade School, and Southern Regional Middle School.
Ownership History
Date
Name
Owned For
Owner Type
Purchase Details
Closed on
May 23, 2005
Sold by
Merante Joseph John and Merante Celeste P
Bought by
Pellenberg Charles and Pellenberg Diane
Current Estimated Value
Home Financials for this Owner
Home Financials are based on the most recent Mortgage that was taken out on this home.
Original Mortgage
$600,000
Outstanding Balance
$314,851
Interest Rate
5.94%
Mortgage Type
Fannie Mae Freddie Mac
Estimated Equity
$1,241,332
Purchase Details
Closed on
Nov 3, 2003
Sold by
Tomasso Ralph J
Bought by
Merante Joseph J and Merante Celeste P
Create a Home Valuation Report for This Property
The Home Valuation Report is an in-depth analysis detailing your home's value as well as a comparison with similar homes in the area
Home Values in the Area
Average Home Value in this Area
Purchase History
| Date | Buyer | Sale Price | Title Company |
|---|---|---|---|
| Pellenberg Charles | $900,000 | -- | |
| Merante Joseph J | $742,000 | -- |
Source: Public Records
Mortgage History
| Date | Status | Borrower | Loan Amount |
|---|---|---|---|
| Open | Pellenberg Charles | $600,000 |
Source: Public Records
Tax History Compared to Growth
Tax History
| Year | Tax Paid | Tax Assessment Tax Assessment Total Assessment is a certain percentage of the fair market value that is determined by local assessors to be the total taxable value of land and additions on the property. | Land | Improvement |
|---|---|---|---|---|
| 2025 | $7,737 | $767,600 | $342,500 | $425,100 |
| 2024 | $6,839 | $767,600 | $342,500 | $425,100 |
| 2023 | $6,348 | $767,600 | $342,500 | $425,100 |
| 2022 | $6,348 | $767,600 | $342,500 | $425,100 |
| 2021 | $6,832 | $767,600 | $342,500 | $425,100 |
| 2020 | $6,931 | $767,600 | $342,500 | $425,100 |
| 2019 | $6,678 | $767,600 | $342,500 | $425,100 |
| 2018 | $6,563 | $767,600 | $342,500 | $425,100 |
| 2017 | $6,793 | $767,600 | $342,500 | $425,100 |
| 2016 | $6,617 | $767,600 | $342,500 | $425,100 |
| 2015 | $6,379 | $767,600 | $342,500 | $425,100 |
| 2014 | $6,938 | $767,500 | $342,500 | $425,000 |
Source: Public Records
Map
Nearby Homes