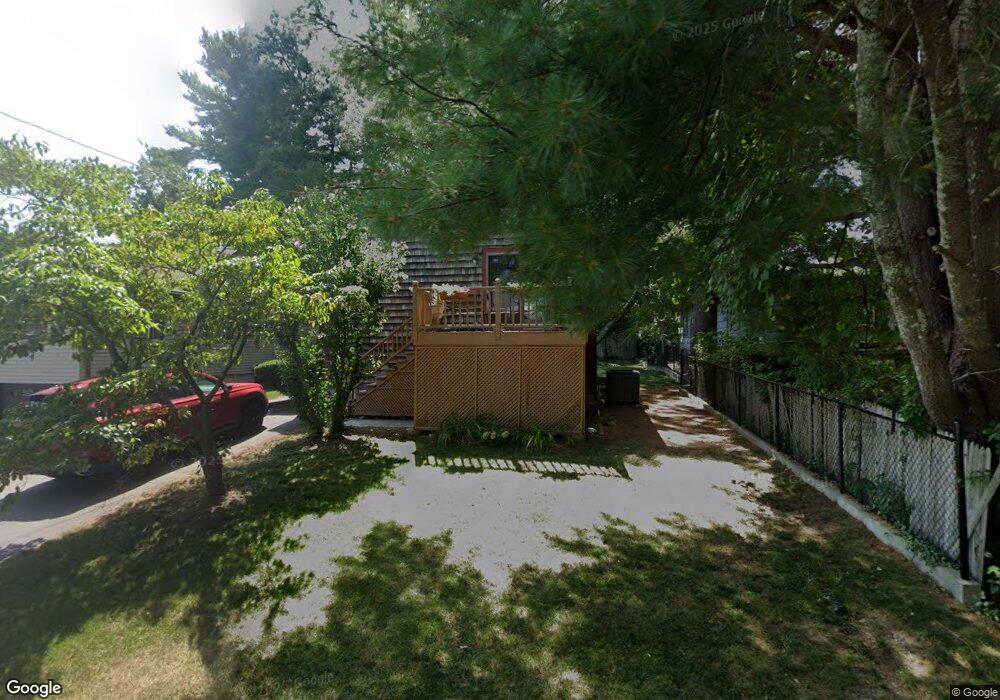
3 W Shore Rd Holbrook, MA 02343
Estimated Value: $492,000 - $591,000
3
Beds
3
Baths
1,615
Sq Ft
$340/Sq Ft
Est. Value
About This Home
This home is located at 3 W Shore Rd, Holbrook, MA 02343 and is currently estimated at $548,558, approximately $339 per square foot. 3 W Shore Rd is a home located in Norfolk County with nearby schools including John F. Kennedy Elementary School, Holbrook Middle High School, and Lighthouse Baptist Christian Academy.
Ownership History
Date
Name
Owned For
Owner Type
Purchase Details
Closed on
Nov 19, 2015
Sold by
Romero Arturo and Romero Edna E
Bought by
Edna Estela and Edna Romero A
Current Estimated Value
Purchase Details
Closed on
Jul 26, 1984
Bought by
Edna & Arturo Romero Ret
Create a Home Valuation Report for This Property
The Home Valuation Report is an in-depth analysis detailing your home's value as well as a comparison with similar homes in the area
Home Values in the Area
Average Home Value in this Area
Purchase History
| Date | Buyer | Sale Price | Title Company |
|---|---|---|---|
| Edna Estela | -- | -- | |
| Edna Estela | -- | -- | |
| Edna Estela | -- | -- | |
| Edna & Arturo Romero Ret | $64,900 | -- |
Source: Public Records
Mortgage History
| Date | Status | Borrower | Loan Amount |
|---|---|---|---|
| Previous Owner | Edna & Arturo Romero Ret | $15,000 | |
| Previous Owner | Edna & Arturo Romero Ret | $56,000 |
Source: Public Records
Tax History Compared to Growth
Tax History
| Year | Tax Paid | Tax Assessment Tax Assessment Total Assessment is a certain percentage of the fair market value that is determined by local assessors to be the total taxable value of land and additions on the property. | Land | Improvement |
|---|---|---|---|---|
| 2025 | $57 | $434,800 | $185,900 | $248,900 |
| 2024 | $5,610 | $417,400 | $185,700 | $231,700 |
| 2023 | $5,952 | $387,000 | $168,800 | $218,200 |
| 2022 | $5,732 | $347,600 | $153,500 | $194,100 |
| 2021 | $5,557 | $322,700 | $139,200 | $183,500 |
| 2020 | $5,768 | $314,000 | $135,000 | $179,000 |
| 2019 | $5,659 | $290,800 | $126,400 | $164,400 |
| 2018 | $5,693 | $275,400 | $117,000 | $158,400 |
| 2017 | $5,373 | $257,100 | $106,200 | $150,900 |
| 2016 | $4,937 | $251,400 | $103,500 | $147,900 |
| 2015 | $4,594 | $240,800 | $99,000 | $141,800 |
| 2014 | $4,407 | $234,800 | $99,000 | $135,800 |
Source: Public Records
Map
Nearby Homes