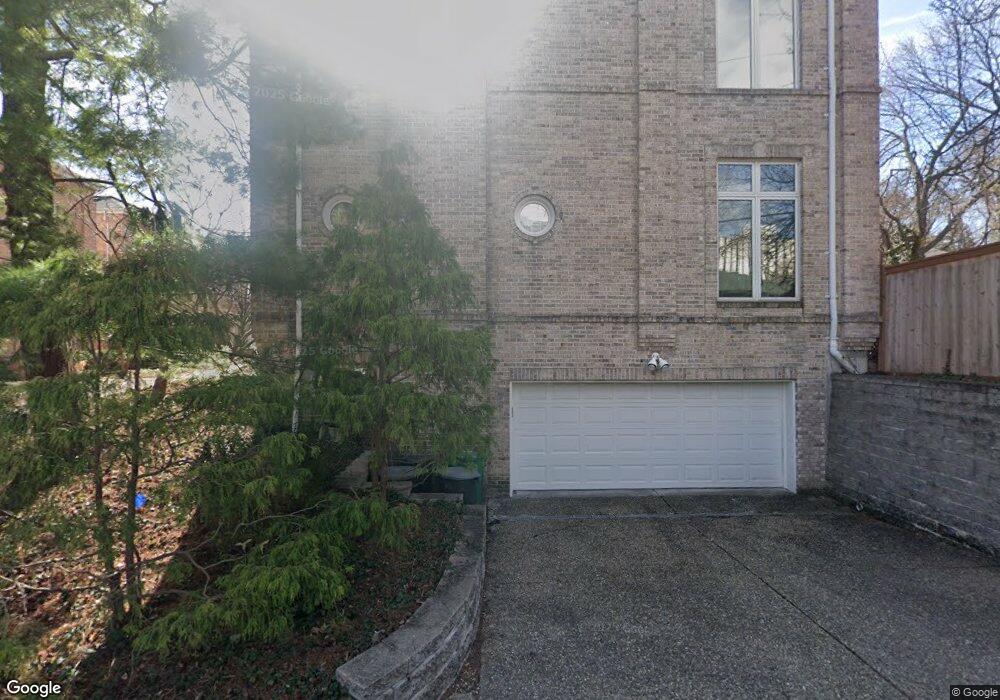
3 W Walinca Walk Saint Louis, MO 63105
Downtown Clayton NeighborhoodEstimated Value: $1,094,000 - $1,311,000
3
Beds
4
Baths
3,404
Sq Ft
$356/Sq Ft
Est. Value
About This Home
This home is located at 3 W Walinca Walk, Saint Louis, MO 63105 and is currently estimated at $1,211,622, approximately $355 per square foot. 3 W Walinca Walk is a home located in St. Louis County with nearby schools including Meramec Elementary, Wydown Middle School, and Clayton High School.
Ownership History
Date
Name
Owned For
Owner Type
Purchase Details
Closed on
Feb 22, 2021
Sold by
Iticovici Silvian and Iticovici Catherine K
Bought by
Silvian Iticovici And Catherine Ifune Trust and Iticovici
Current Estimated Value
Purchase Details
Closed on
Jan 4, 2014
Sold by
Iticovici Silvian and Ifune Catherine
Bought by
Iticovici Silvian and Ifune Catherine K
Home Financials for this Owner
Home Financials are based on the most recent Mortgage that was taken out on this home.
Original Mortgage
$677,700
Interest Rate
4.47%
Mortgage Type
New Conventional
Purchase Details
Closed on
Oct 21, 2005
Sold by
Hirsch Raymond R and Hirsch Joanne D
Bought by
Iticovici Silvian and Infune Cathy
Home Financials for this Owner
Home Financials are based on the most recent Mortgage that was taken out on this home.
Original Mortgage
$86,250
Interest Rate
5.69%
Mortgage Type
Fannie Mae Freddie Mac
Create a Home Valuation Report for This Property
The Home Valuation Report is an in-depth analysis detailing your home's value as well as a comparison with similar homes in the area
Home Values in the Area
Average Home Value in this Area
Purchase History
| Date | Buyer | Sale Price | Title Company |
|---|---|---|---|
| Silvian Iticovici And Catherine Ifune Trust | -- | None Listed On Document | |
| Iticovici Silvian | -- | Servicelink Aliquippa Title | |
| Iticovici Silvian | $862,500 | -- |
Source: Public Records
Mortgage History
| Date | Status | Borrower | Loan Amount |
|---|---|---|---|
| Previous Owner | Iticovici Silvian | $677,700 | |
| Previous Owner | Iticovici Silvian | $86,250 | |
| Previous Owner | Iticovici Silvian | $690,000 |
Source: Public Records
Tax History Compared to Growth
Tax History
| Year | Tax Paid | Tax Assessment Tax Assessment Total Assessment is a certain percentage of the fair market value that is determined by local assessors to be the total taxable value of land and additions on the property. | Land | Improvement |
|---|---|---|---|---|
| 2025 | $11,871 | $186,470 | $91,870 | $94,600 |
| 2024 | $11,871 | $174,510 | $72,520 | $101,990 |
| 2023 | $11,858 | $174,510 | $72,520 | $101,990 |
| 2022 | $12,060 | $167,910 | $58,010 | $109,900 |
| 2021 | $12,017 | $167,910 | $58,010 | $109,900 |
| 2020 | $12,122 | $164,070 | $56,640 | $107,430 |
| 2019 | $11,959 | $164,070 | $56,640 | $107,430 |
| 2018 | $10,280 | $143,450 | $52,400 | $91,050 |
| 2017 | $10,212 | $143,450 | $52,400 | $91,050 |
| 2016 | $9,028 | $120,760 | $38,130 | $82,630 |
| 2015 | $9,108 | $120,760 | $38,130 | $82,630 |
| 2014 | $10,284 | $131,010 | $22,990 | $108,020 |
Source: Public Records
Map
Nearby Homes
- 314 S Hanley Rd Unit 1N
- 7642 Carswold Dr
- 7570 Byron Place Unit 1E
- 250 S Brentwood Blvd Unit 1H
- 250 S Brentwood Blvd Unit 1D
- 150 Carondelet Plaza Unit 302
- 150 Carondelet Plaza Unit 2801
- 150 Carondelet Plaza Unit 2901
- 710 S Hanley Rd Unit 18B
- 710 S Hanley Rd Unit 17C
- 200 S Brentwood Blvd Unit 15C
- 155 Carondelet Plaza Unit 600
- 731 Westwood Dr Unit 1S
- 750 S Hanley Rd Unit 180
- 750 S Hanley Rd Unit 68
- 520 S Brentwood Blvd Unit 3A
- 7521 Byron Place Unit 3E
- 816 S Hanley Rd Unit 8C
- 907 S Hanley Rd Unit 5
- 7520 Buckingham Dr Unit 1E
- 1 W Walinca Walk
- 4 W Walinca Walk
- 520 E Polo Dr
- 7724 Country Club Ct
- 2 W Walinca Walk
- 7716 Country Club Ct
- 2 W Walinca Walk
- 518 E Polo Dr
- 7728 Country Club Ct
- 522 E Polo Dr
- 7712 Country Club Ct
- 3 E Walinca Walk
- 1 E Walinca Walk
- 7708 Country Club Ct
- 508 E Polo Dr
- 7732 Country Club Ct
- 7718 Walinca Terrace
- 504 E Polo Dr
- 4 E Walinca Walk
- 7731 Country Club Ct