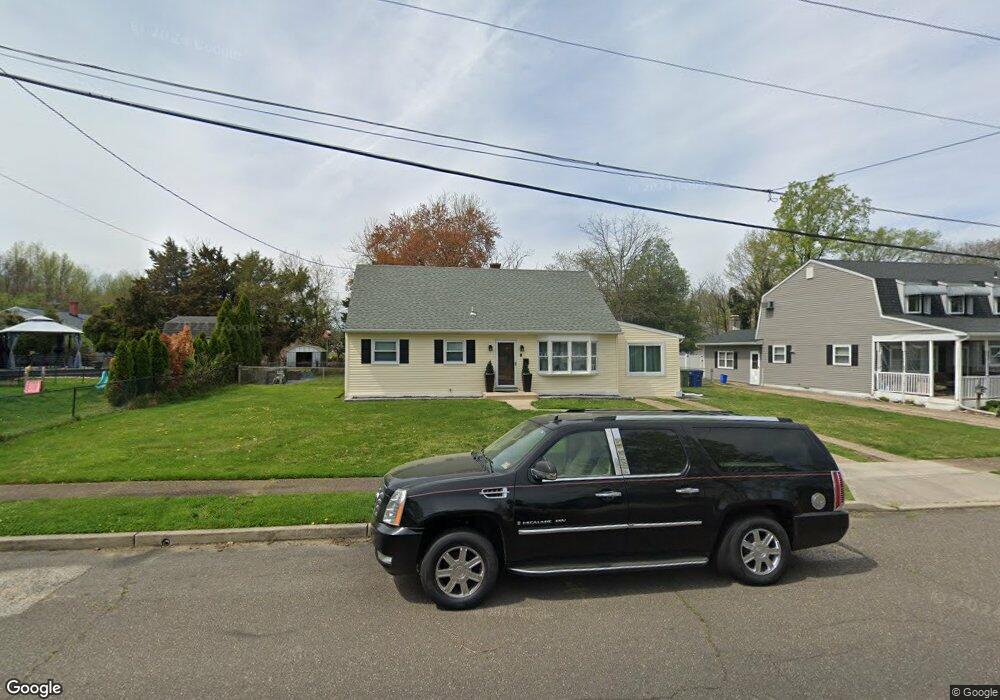
3 Walden Rd Marlton, NJ 08053
Estimated Value: $258,000 - $318,000
--
Bed
--
Bath
988
Sq Ft
$295/Sq Ft
Est. Value
About This Home
This home is located at 3 Walden Rd, Marlton, NJ 08053 and is currently estimated at $291,106, approximately $294 per square foot. 3 Walden Rd is a home located in Burlington County with nearby schools including H.L. Beeler Elementary School, Marlton Middle School, and Cherokee High School.
Ownership History
Date
Name
Owned For
Owner Type
Purchase Details
Closed on
Sep 27, 2021
Sold by
Addiego Dawn Marie and Estate Of Anna I Johnston
Bought by
Casella Dante
Current Estimated Value
Home Financials for this Owner
Home Financials are based on the most recent Mortgage that was taken out on this home.
Original Mortgage
$160,000
Outstanding Balance
$145,905
Interest Rate
2.8%
Mortgage Type
New Conventional
Estimated Equity
$145,201
Purchase Details
Closed on
Oct 24, 1997
Sold by
Bishop James W and Bishop Arlene B
Bought by
Johnston Anna I
Create a Home Valuation Report for This Property
The Home Valuation Report is an in-depth analysis detailing your home's value as well as a comparison with similar homes in the area
Home Values in the Area
Average Home Value in this Area
Purchase History
| Date | Buyer | Sale Price | Title Company |
|---|---|---|---|
| Casella Dante | $172,000 | National Integrity Llc | |
| Casella Dante | $172,000 | None Listed On Document | |
| Johnston Anna I | $96,500 | Surety Title Corporation |
Source: Public Records
Mortgage History
| Date | Status | Borrower | Loan Amount |
|---|---|---|---|
| Open | Casella Dante | $160,000 | |
| Closed | Casella Dante | $160,000 |
Source: Public Records
Tax History Compared to Growth
Tax History
| Year | Tax Paid | Tax Assessment Tax Assessment Total Assessment is a certain percentage of the fair market value that is determined by local assessors to be the total taxable value of land and additions on the property. | Land | Improvement |
|---|---|---|---|---|
| 2025 | $5,635 | $165,000 | $100,000 | $65,000 |
| 2024 | $5,301 | $165,000 | $100,000 | $65,000 |
| 2023 | $5,301 | $165,000 | $100,000 | $65,000 |
| 2022 | $5,064 | $165,000 | $100,000 | $65,000 |
| 2021 | $3,678 | $165,000 | $100,000 | $65,000 |
| 2020 | $4,881 | $165,000 | $100,000 | $65,000 |
| 2019 | $4,841 | $165,000 | $100,000 | $65,000 |
| 2018 | $4,773 | $165,000 | $100,000 | $65,000 |
| 2017 | $4,717 | $165,000 | $100,000 | $65,000 |
| 2016 | $4,602 | $165,000 | $100,000 | $65,000 |
| 2015 | $4,521 | $165,000 | $100,000 | $65,000 |
| 2014 | $5,454 | $204,900 | $115,000 | $89,900 |
Source: Public Records
Map
Nearby Homes