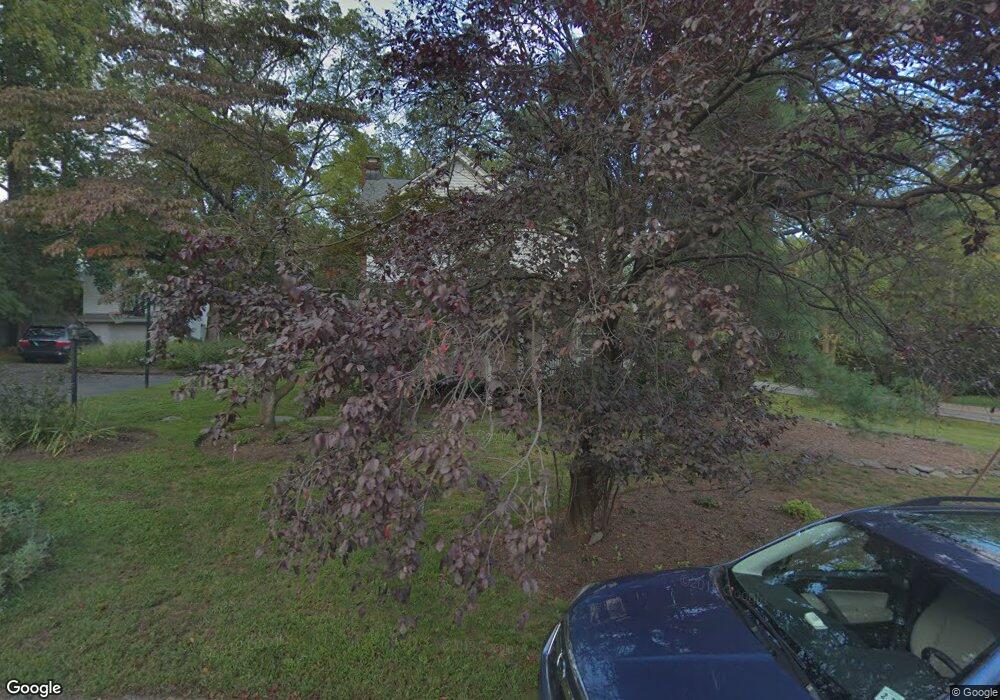
3 Werimus Rd Woodcliff Lake, NJ 07677
Estimated Value: $901,014 - $1,054,000
--
Bed
--
Bath
3,023
Sq Ft
$327/Sq Ft
Est. Value
About This Home
This home is located at 3 Werimus Rd, Woodcliff Lake, NJ 07677 and is currently estimated at $987,254, approximately $326 per square foot. 3 Werimus Rd is a home located in Bergen County with nearby schools including Dorchester Elementary School, Woodcliff Middle School, and Pascack Hills High School.
Ownership History
Date
Name
Owned For
Owner Type
Purchase Details
Closed on
May 24, 2021
Sold by
Denbeaux Mark P and Estate Of Marcia W Denbeaux
Bought by
Denbeaux Mark P
Current Estimated Value
Home Financials for this Owner
Home Financials are based on the most recent Mortgage that was taken out on this home.
Original Mortgage
$320,000
Outstanding Balance
$289,088
Interest Rate
2.9%
Mortgage Type
New Conventional
Estimated Equity
$698,166
Create a Home Valuation Report for This Property
The Home Valuation Report is an in-depth analysis detailing your home's value as well as a comparison with similar homes in the area
Home Values in the Area
Average Home Value in this Area
Purchase History
| Date | Buyer | Sale Price | Title Company |
|---|---|---|---|
| Denbeaux Mark P | -- | Kingsbridge Title Agency Llc | |
| Denbeaux Mark P | -- | Kingsbridge Title |
Source: Public Records
Mortgage History
| Date | Status | Borrower | Loan Amount |
|---|---|---|---|
| Open | Denbeaux Mark P | $320,000 | |
| Closed | Denbeaux Mark P | $320,000 |
Source: Public Records
Tax History Compared to Growth
Tax History
| Year | Tax Paid | Tax Assessment Tax Assessment Total Assessment is a certain percentage of the fair market value that is determined by local assessors to be the total taxable value of land and additions on the property. | Land | Improvement |
|---|---|---|---|---|
| 2025 | $13,962 | $664,500 | $346,800 | $317,700 |
| 2024 | $13,533 | $645,800 | $337,000 | $308,800 |
| 2023 | $12,200 | $625,100 | $330,600 | $294,500 |
| 2022 | $12,200 | $557,600 | $277,400 | $280,200 |
| 2021 | $11,922 | $544,400 | $271,300 | $273,100 |
| 2020 | $11,358 | $540,600 | $269,300 | $271,300 |
| 2019 | $11,143 | $533,400 | $265,700 | $267,700 |
| 2018 | $10,914 | $526,500 | $262,400 | $264,100 |
| 2017 | $10,837 | $518,000 | $259,200 | $258,800 |
| 2016 | $10,992 | $512,700 | $255,100 | $257,600 |
| 2015 | $10,704 | $504,200 | $251,100 | $253,100 |
| 2014 | $10,687 | $483,800 | $239,800 | $244,000 |
Source: Public Records
Map
Nearby Homes
- 42 Werimus Rd
- 61 Overlook Dr
- 7 Stony Ridge Dr
- 21 Hunter Ridge
- 4 Lesa Ln
- 100 Overlook Dr
- 140 Oak Trail Rd
- 91 Wierimus Rd
- 47 Twin Brooks Rd
- 26 Daniel Ct
- 2 Wierimus Ln
- 198 Pascack Rd
- 36 Wildwood Rd
- 14 Werimus Brook Rd
- 16 Old Farms Rd
- 10 Werimus Brook Rd
- 23 Fillmore Dr
- 5 Academy Rd
- 207 Ell Rd
- 59 White Beeches Dr Unit 59C