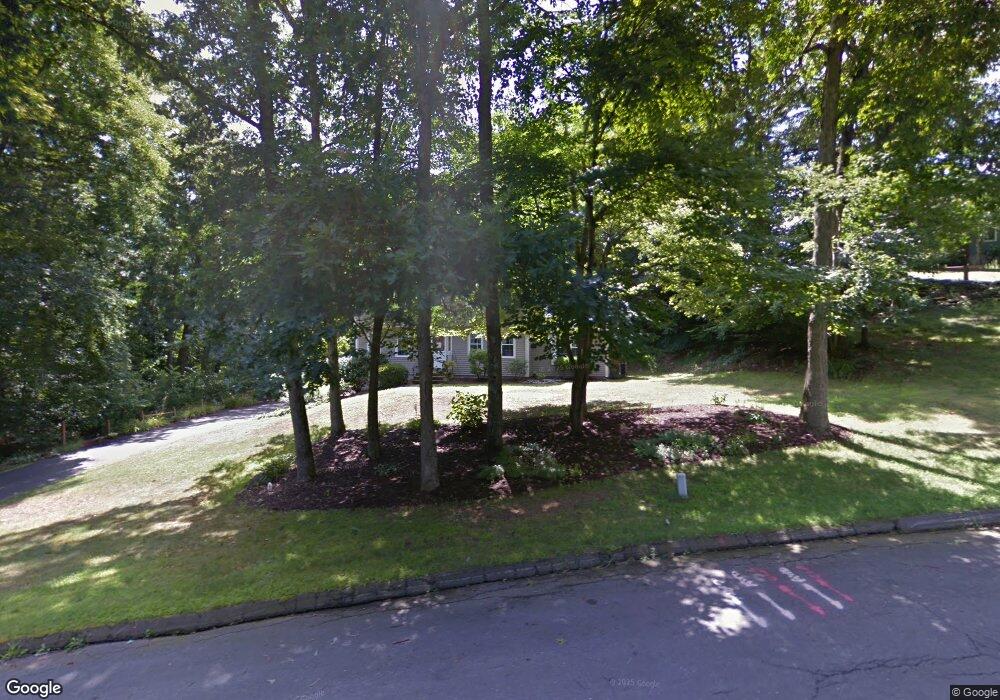
3 Wexford Ln Cromwell, CT 06416
Estimated Value: $551,000 - $610,000
4
Beds
3
Baths
1,850
Sq Ft
$314/Sq Ft
Est. Value
About This Home
This home is located at 3 Wexford Ln, Cromwell, CT 06416 and is currently estimated at $580,959, approximately $314 per square foot. 3 Wexford Ln is a home located in Middlesex County with nearby schools including Edna C. Stevens School, Woodside Intermediate School, and Cromwell Middle School.
Ownership History
Date
Name
Owned For
Owner Type
Purchase Details
Closed on
Jun 28, 2002
Sold by
Mascola Marc S and Mascola Kristin Jk
Bought by
Ramierz Joseph A and Ramierz Deborrah A
Current Estimated Value
Purchase Details
Closed on
Aug 25, 1997
Sold by
Quart Douglas E and Quart Mary J
Bought by
Mascola Marc S and Kennedy Kristin J
Create a Home Valuation Report for This Property
The Home Valuation Report is an in-depth analysis detailing your home's value as well as a comparison with similar homes in the area
Home Values in the Area
Average Home Value in this Area
Purchase History
| Date | Buyer | Sale Price | Title Company |
|---|---|---|---|
| Ramierz Joseph A | $264,900 | -- | |
| Mascola Marc S | $187,000 | -- | |
| Ramierz Joseph A | $264,900 | -- | |
| Mascola Marc S | $187,000 | -- |
Source: Public Records
Mortgage History
| Date | Status | Borrower | Loan Amount |
|---|---|---|---|
| Open | Mascola Marc S | $25,000 | |
| Closed | Mascola Marc S | $80,000 | |
| Closed | Mascola Marc S | $217,600 |
Source: Public Records
Tax History Compared to Growth
Tax History
| Year | Tax Paid | Tax Assessment Tax Assessment Total Assessment is a certain percentage of the fair market value that is determined by local assessors to be the total taxable value of land and additions on the property. | Land | Improvement |
|---|---|---|---|---|
| 2025 | $8,059 | $261,730 | $93,310 | $168,420 |
| 2024 | $7,870 | $261,730 | $93,310 | $168,420 |
| 2023 | $7,697 | $261,730 | $93,310 | $168,420 |
| 2022 | $6,397 | $191,940 | $84,420 | $107,520 |
| 2021 | $6,397 | $191,940 | $84,420 | $107,520 |
| 2020 | $6,301 | $191,940 | $84,420 | $107,520 |
| 2019 | $6,301 | $191,940 | $84,420 | $107,520 |
| 2018 | $6,301 | $191,940 | $84,420 | $107,520 |
| 2017 | $6,365 | $187,580 | $87,960 | $99,620 |
| 2016 | $6,308 | $187,580 | $87,960 | $99,620 |
| 2015 | $5,886 | $187,580 | $87,960 | $99,620 |
| 2014 | $6,243 | $187,580 | $87,960 | $99,620 |
Source: Public Records
Map
Nearby Homes
- 44 Primrose Ln
- 35 Primrose Ln
- 0 Primrose Ln
- 23 Primrose Ln
- 4 Lower Heatherwood
- 4 Lower Heatherwood Unit 4
- 587 Main St
- 5 Northbridge
- 17 Oakwood Manor
- 6 Whitney Ct
- 12 Fairview Heights
- 20 Evergreen Rd
- 14 Wildwood Rd
- 24 Iron Gate Ln
- 15 Oxford Ln
- 5 Shelley St
- 3 W Street Heights
- 5 Palmer Cir
- 18 W Street Terrace
- 58 Cedar Terrace