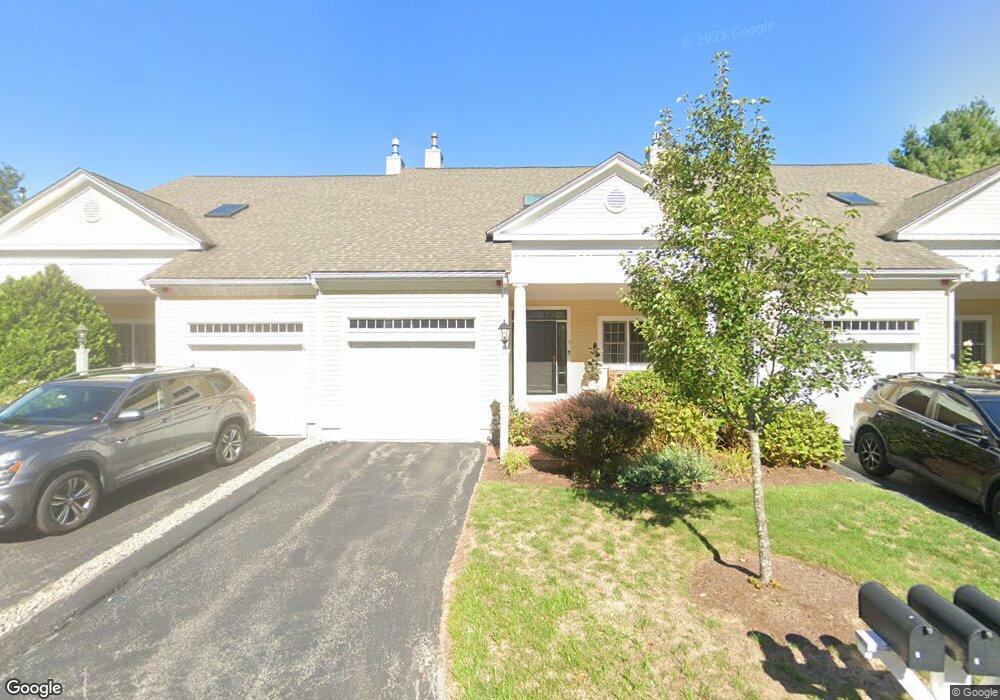
3 Whiting Ln Hingham, MA 02043
South Hingham NeighborhoodEstimated Value: $900,000 - $1,073,000
2
Beds
3
Baths
2,350
Sq Ft
$419/Sq Ft
Est. Value
About This Home
This home is located at 3 Whiting Ln, Hingham, MA 02043 and is currently estimated at $985,148, approximately $419 per square foot. 3 Whiting Ln is a home located in Plymouth County with nearby schools including South Elementary School, Hingham Middle School, and Hingham High School.
Ownership History
Date
Name
Owned For
Owner Type
Purchase Details
Closed on
May 12, 2017
Sold by
Us Bank Na Tr
Bought by
Robinson Elsie L and Touma Christopher J
Current Estimated Value
Home Financials for this Owner
Home Financials are based on the most recent Mortgage that was taken out on this home.
Original Mortgage
$388,000
Outstanding Balance
$323,023
Interest Rate
4.14%
Mortgage Type
New Conventional
Estimated Equity
$662,125
Purchase Details
Closed on
Apr 2, 2013
Sold by
Danastorg Reba A
Bought by
Us Bank Na
Purchase Details
Closed on
Dec 6, 2002
Sold by
Lowe Accord Llc Tr and Pearson Carl
Bought by
Danastorg Reba A
Create a Home Valuation Report for This Property
The Home Valuation Report is an in-depth analysis detailing your home's value as well as a comparison with similar homes in the area
Home Values in the Area
Average Home Value in this Area
Purchase History
| Date | Buyer | Sale Price | Title Company |
|---|---|---|---|
| Robinson Elsie L | $485,000 | -- | |
| Us Bank Na | $470,000 | -- | |
| Danastorg Reba A | $409,900 | -- |
Source: Public Records
Mortgage History
| Date | Status | Borrower | Loan Amount |
|---|---|---|---|
| Open | Robinson Elsie L | $388,000 | |
| Previous Owner | Danastorg Reba A | $100,000 | |
| Previous Owner | Danastorg Reba A | $5,541 | |
| Previous Owner | Danastorg Reba A | $476,250 | |
| Previous Owner | Danastorg Reba A | $4,800 |
Source: Public Records
Tax History
| Year | Tax Paid | Tax Assessment Tax Assessment Total Assessment is a certain percentage of the fair market value that is determined by local assessors to be the total taxable value of land and additions on the property. | Land | Improvement |
|---|---|---|---|---|
| 2025 | $7,765 | $726,400 | $0 | $726,400 |
| 2024 | $7,184 | $662,100 | $0 | $662,100 |
| 2023 | $6,118 | $611,800 | $0 | $611,800 |
| 2022 | $7,277 | $629,500 | $0 | $629,500 |
| 2021 | $7,174 | $608,000 | $0 | $608,000 |
| 2020 | $7,010 | $608,000 | $0 | $608,000 |
| 2019 | $6,925 | $586,400 | $0 | $586,400 |
| 2018 | $6,565 | $557,800 | $0 | $557,800 |
| 2017 | $6,559 | $535,400 | $0 | $535,400 |
| 2016 | $6,436 | $515,300 | $0 | $515,300 |
| 2015 | $6,140 | $490,000 | $0 | $490,000 |
Source: Public Records
Map
Nearby Homes
- 18 Whiting Ln
- 183 Gardner St
- 4 Kerri Ln
- 100 Whiting St
- 1 Kerri Ln
- 5 Old County Rd
- 17 Pine Haven Cir
- 1276 Washington St Unit A
- 7 Elizabeth Ln Unit 7
- 9 Elizabeth Ln Unit 9
- 1 Elizabeth Ln Unit 1
- 3 Elizabeth Ln Unit 3
- 13 Elizabeth Ln Unit 13
- 5 Elizabeth Ln Unit 5
- 15 Elizabeth Ln Unit 15
- 17 Elizabeth Ln Unit 17
- 19 Elizabeth Ln
- 11 Elizabeth Ln
- 341 Ralph Talbot St
- 2 Black Rock Dr Unit 21
Your Personal Tour Guide
Ask me questions while you tour the home.