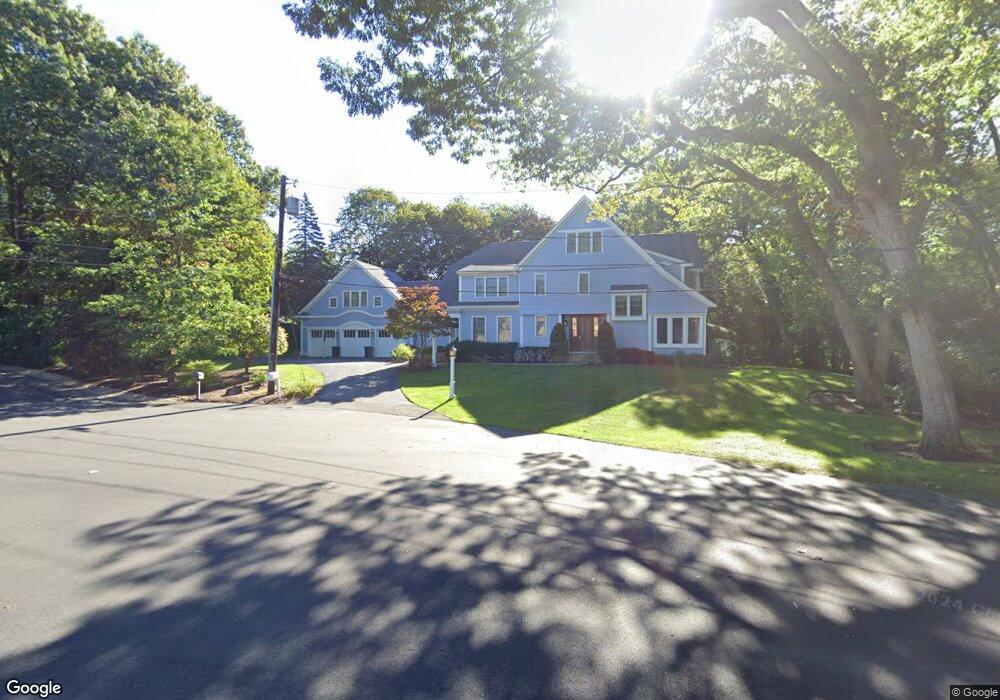
3 Whitman Cir Lexington, MA 02420
Munroe Hill NeighborhoodEstimated Value: $3,240,208 - $4,013,000
5
Beds
6
Baths
5,694
Sq Ft
$652/Sq Ft
Est. Value
About This Home
This home is located at 3 Whitman Cir, Lexington, MA 02420 and is currently estimated at $3,714,052, approximately $652 per square foot. 3 Whitman Cir is a home located in Middlesex County with nearby schools including Fiske Elementary School, William Diamond Middle School, and Lexington High School.
Ownership History
Date
Name
Owned For
Owner Type
Purchase Details
Closed on
Apr 9, 2018
Sold by
Liu David R and Liu Julie F
Bought by
Julie F Liu T
Current Estimated Value
Purchase Details
Closed on
May 17, 2005
Sold by
Lanham Homes Llc
Bought by
Liu David R and Liu Julie F
Home Financials for this Owner
Home Financials are based on the most recent Mortgage that was taken out on this home.
Original Mortgage
$945,000
Interest Rate
6.05%
Mortgage Type
Purchase Money Mortgage
Purchase Details
Closed on
Nov 6, 2002
Sold by
Lanman Julia B Est
Bought by
Lanman Homes Llc
Home Financials for this Owner
Home Financials are based on the most recent Mortgage that was taken out on this home.
Original Mortgage
$700,000
Interest Rate
6.04%
Mortgage Type
Purchase Money Mortgage
Create a Home Valuation Report for This Property
The Home Valuation Report is an in-depth analysis detailing your home's value as well as a comparison with similar homes in the area
Home Values in the Area
Average Home Value in this Area
Purchase History
| Date | Buyer | Sale Price | Title Company |
|---|---|---|---|
| Julie F Liu T | -- | -- | |
| Liu David R | $1,921,487 | -- | |
| Lanman Homes Llc | $540,000 | -- |
Source: Public Records
Mortgage History
| Date | Status | Borrower | Loan Amount |
|---|---|---|---|
| Previous Owner | Liu David R | $945,000 | |
| Previous Owner | Lanman Homes Llc | $700,000 |
Source: Public Records
Tax History Compared to Growth
Tax History
| Year | Tax Paid | Tax Assessment Tax Assessment Total Assessment is a certain percentage of the fair market value that is determined by local assessors to be the total taxable value of land and additions on the property. | Land | Improvement |
|---|---|---|---|---|
| 2025 | $34,342 | $2,808,000 | $961,000 | $1,847,000 |
| 2024 | $32,610 | $2,662,000 | $915,000 | $1,747,000 |
| 2023 | $30,121 | $2,317,000 | $832,000 | $1,485,000 |
| 2022 | $30,029 | $2,176,000 | $757,000 | $1,419,000 |
| 2021 | $29,053 | $2,019,000 | $751,000 | $1,268,000 |
| 2020 | $29,533 | $2,102,000 | $751,000 | $1,351,000 |
| 2019 | $28,325 | $2,006,000 | $715,000 | $1,291,000 |
| 2018 | $27,842 | $1,947,000 | $681,000 | $1,266,000 |
| 2017 | $26,459 | $1,826,000 | $649,000 | $1,177,000 |
| 2016 | $26,061 | $1,785,000 | $618,000 | $1,167,000 |
| 2015 | $25,425 | $1,711,000 | $562,000 | $1,149,000 |
| 2014 | $25,917 | $1,671,000 | $511,000 | $1,160,000 |
Source: Public Records
Map
Nearby Homes