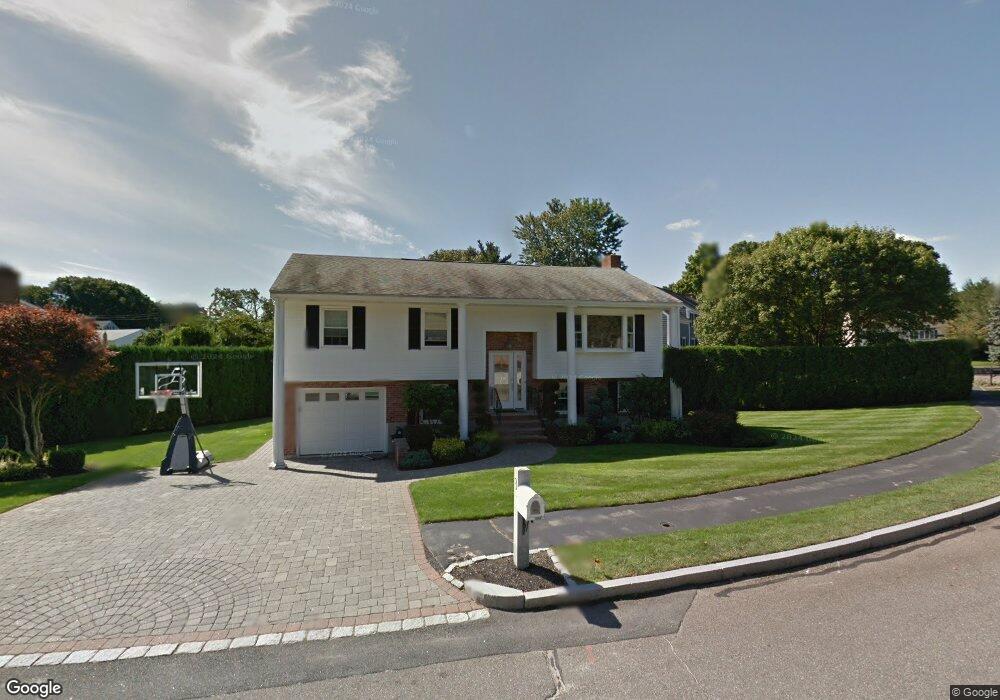
3 Whittemore Ln Stoneham, MA 02180
Colonial Park NeighborhoodEstimated Value: $860,000 - $1,014,000
3
Beds
2
Baths
2,463
Sq Ft
$380/Sq Ft
Est. Value
About This Home
This home is located at 3 Whittemore Ln, Stoneham, MA 02180 and is currently estimated at $935,073, approximately $379 per square foot. 3 Whittemore Ln is a home located in Middlesex County with nearby schools including Stoneham High School, St. Patrick Elementary School, and Greater Boston Academy.
Ownership History
Date
Name
Owned For
Owner Type
Purchase Details
Closed on
Jul 14, 2015
Sold by
Lopriore Marylu F and Lopriore John P
Bought by
Lopriore Marylu F
Current Estimated Value
Home Financials for this Owner
Home Financials are based on the most recent Mortgage that was taken out on this home.
Original Mortgage
$411,600
Outstanding Balance
$321,053
Interest Rate
3.87%
Mortgage Type
New Conventional
Estimated Equity
$614,020
Purchase Details
Closed on
Feb 26, 1999
Sold by
Hilliard Lawrence J and Hilliard Linda
Bought by
Lopriore John P and Susi Marylu F
Home Financials for this Owner
Home Financials are based on the most recent Mortgage that was taken out on this home.
Original Mortgage
$223,900
Interest Rate
6.78%
Mortgage Type
Purchase Money Mortgage
Create a Home Valuation Report for This Property
The Home Valuation Report is an in-depth analysis detailing your home's value as well as a comparison with similar homes in the area
Home Values in the Area
Average Home Value in this Area
Purchase History
| Date | Buyer | Sale Price | Title Company |
|---|---|---|---|
| Lopriore Marylu F | -- | -- | |
| Lopriore John P | $279,900 | -- |
Source: Public Records
Mortgage History
| Date | Status | Borrower | Loan Amount |
|---|---|---|---|
| Open | Lopriore Marylu F | $411,600 | |
| Previous Owner | Lopriore John P | $223,900 | |
| Previous Owner | Lopriore John P | $184,400 | |
| Previous Owner | Lopriore John P | $188,000 |
Source: Public Records
Tax History
| Year | Tax Paid | Tax Assessment Tax Assessment Total Assessment is a certain percentage of the fair market value that is determined by local assessors to be the total taxable value of land and additions on the property. | Land | Improvement |
|---|---|---|---|---|
| 2025 | $8,172 | $798,800 | $400,000 | $398,800 |
| 2024 | $7,845 | $740,800 | $370,000 | $370,800 |
| 2023 | $7,605 | $685,100 | $340,000 | $345,100 |
| 2022 | $6,678 | $641,500 | $320,000 | $321,500 |
| 2021 | $6,481 | $599,000 | $300,000 | $299,000 |
| 2020 | $6,500 | $602,400 | $300,000 | $302,400 |
| 2019 | $6,526 | $581,600 | $270,000 | $311,600 |
| 2018 | $6,340 | $541,400 | $260,000 | $281,400 |
| 2017 | $5,950 | $480,200 | $230,000 | $250,200 |
| 2016 | $5,869 | $462,100 | $230,000 | $232,100 |
| 2015 | $6,003 | $463,200 | $230,000 | $233,200 |
| 2014 | $5,898 | $437,200 | $220,000 | $217,200 |
Source: Public Records
Map
Nearby Homes
- 12 Lovis Ave
- 9 Lovis Ave
- 31 Tamarock Terrace
- 4 Gavin Cir
- 3 Fellsmere Ave
- 11 Ludlow Ave
- 15 Belmont Rd
- 51 Spring St
- 6 Vinton Ct
- 15 Valdora Dr
- 5 Chapel Way
- 824 Main St Unit 1
- 894 Main St Unit 8
- 17 Franklin St
- 8 Gates Ln Unit A
- 159 Franklin St Unit D2
- 159 Franklin St Unit E6
- 177 Franklin St Unit 2
- 4 Garfield Ave
- 137 Franklin St Unit 406
Your Personal Tour Guide
Ask me questions while you tour the home.