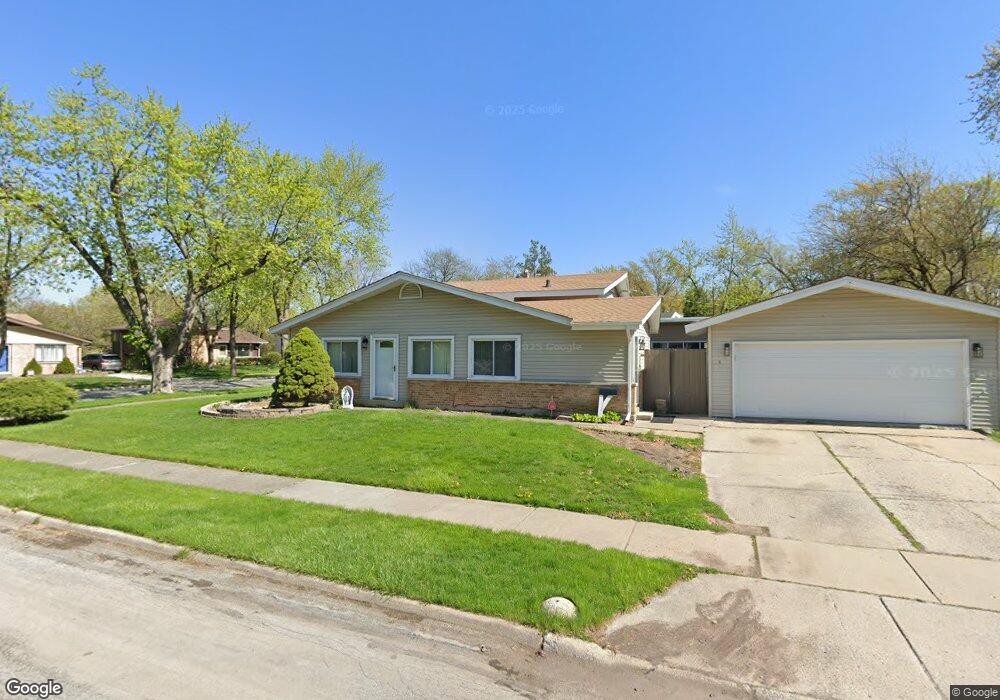
3 Wilson Ct Park Forest, IL 60466
Estimated Value: $162,000 - $222,000
3
Beds
2
Baths
1,186
Sq Ft
$160/Sq Ft
Est. Value
About This Home
This home is located at 3 Wilson Ct, Park Forest, IL 60466 and is currently estimated at $190,215, approximately $160 per square foot. 3 Wilson Ct is a home located in Cook County with nearby schools including Michelle Obama School of Technology, Blackhawk Intermediate Center, and Barack Obama School of Leadership and STEM.
Ownership History
Date
Name
Owned For
Owner Type
Purchase Details
Closed on
Nov 21, 2003
Sold by
Hud
Bought by
Smith King M
Current Estimated Value
Home Financials for this Owner
Home Financials are based on the most recent Mortgage that was taken out on this home.
Original Mortgage
$82,745
Interest Rate
6.08%
Mortgage Type
Unknown
Purchase Details
Closed on
Dec 6, 2002
Sold by
Felix Dranon S and Felix Tandra
Bought by
Hud
Purchase Details
Closed on
Jan 6, 1996
Sold by
Beverly Trust Company
Bought by
Felix Dranon S
Home Financials for this Owner
Home Financials are based on the most recent Mortgage that was taken out on this home.
Original Mortgage
$89,162
Interest Rate
7.36%
Mortgage Type
FHA
Purchase Details
Closed on
Dec 9, 1994
Sold by
Dickover Kenneth A and Dickover Christine M
Bought by
Beverly Trust Company
Create a Home Valuation Report for This Property
The Home Valuation Report is an in-depth analysis detailing your home's value as well as a comparison with similar homes in the area
Home Values in the Area
Average Home Value in this Area
Purchase History
| Date | Buyer | Sale Price | Title Company |
|---|---|---|---|
| Smith King M | -- | Stewart Title Of Illinois | |
| Hud | -- | -- | |
| Hud | -- | -- | |
| Felix Dranon S | -- | -- | |
| Felix Dranon S | $90,000 | -- | |
| Beverly Trust Company | $92,500 | -- |
Source: Public Records
Mortgage History
| Date | Status | Borrower | Loan Amount |
|---|---|---|---|
| Previous Owner | Smith King M | $82,745 | |
| Previous Owner | Felix Dranon S | $89,162 |
Source: Public Records
Tax History
| Year | Tax Paid | Tax Assessment Tax Assessment Total Assessment is a certain percentage of the fair market value that is determined by local assessors to be the total taxable value of land and additions on the property. | Land | Improvement |
|---|---|---|---|---|
| 2025 | $10,749 | $18,000 | $3,360 | $14,640 |
| 2024 | $10,749 | $18,000 | $3,360 | $14,640 |
| 2023 | $5,531 | $18,000 | $3,360 | $14,640 |
| 2022 | $5,531 | $7,535 | $3,120 | $4,415 |
| 2021 | $5,546 | $7,534 | $3,120 | $4,414 |
| 2020 | $5,331 | $7,534 | $3,120 | $4,414 |
| 2019 | $6,341 | $9,255 | $2,880 | $6,375 |
| 2018 | $6,560 | $9,689 | $2,880 | $6,809 |
| 2017 | $6,582 | $9,689 | $2,880 | $6,809 |
| 2016 | $5,472 | $8,001 | $2,640 | $5,361 |
| 2015 | $5,225 | $8,001 | $2,640 | $5,361 |
| 2014 | $5,123 | $8,001 | $2,640 | $5,361 |
| 2013 | $6,752 | $10,622 | $2,640 | $7,982 |
Source: Public Records
Map
Nearby Homes
- 109 Wilson St
- 305 Winnebago St
- 124 Wilson St
- 306 Winnebago St
- 109 Walnut St
- 354 Westgate Dr
- 356 Winnebago St
- 115 Willow St
- 202 Wilson St
- 354 Winona St
- 356 Wilshire St
- 129 Warwick St
- 409 Winnemac St
- 3435 218th Place
- 506 Wildwood Dr
- 338 Waldmann Dr
- 377 Wilshire St
- 356 Waverly St
- 4 Lakewood Ct
- 251 Westwood Dr
- 5 Wilson Ct
- 4 Wilson Ct
- 319 Winnebago St
- 117 Wilson St
- 6 Wilson Ct
- 328 Winnebago St
- 119 Wilson St
- 326 Winnebago St
- 333 Winnebago St
- 317 Winnebago St
- 324 Winnebago St
- 332 Winnebago St
- 111 Wilson St
- 322 Winnebago St
- 335 Winnebago St
- 315 Winnebago St
- 334 Winnebago St
- 320 Winnebago St
- 9 Wilson Ct
- 336 Winnebago St
Your Personal Tour Guide
Ask me questions while you tour the home.