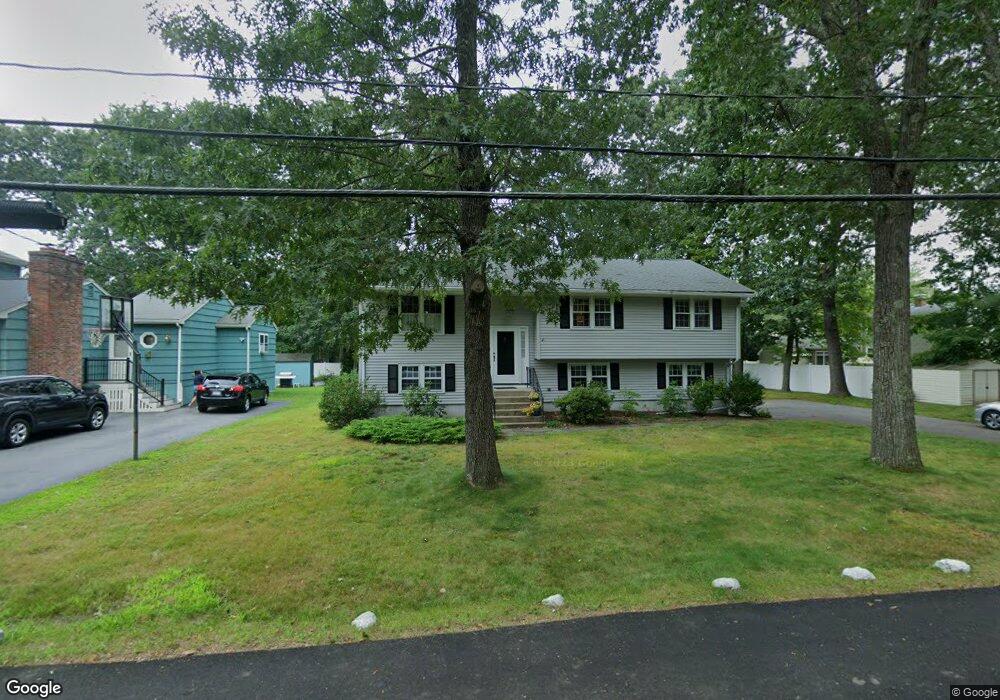
3 Windsor Ave Natick, MA 01760
Estimated Value: $690,000 - $819,000
3
Beds
3
Baths
1,310
Sq Ft
$593/Sq Ft
Est. Value
About This Home
This home is located at 3 Windsor Ave, Natick, MA 01760 and is currently estimated at $777,203, approximately $593 per square foot. 3 Windsor Ave is a home located in Middlesex County with nearby schools including Natick High School, J F Kennedy Middle School, and Johnson Elementary School.
Ownership History
Date
Name
Owned For
Owner Type
Purchase Details
Closed on
May 25, 1994
Sold by
Higgins Lola M
Bought by
Regan Paul J and Regan Ann F
Current Estimated Value
Home Financials for this Owner
Home Financials are based on the most recent Mortgage that was taken out on this home.
Original Mortgage
$105,000
Interest Rate
8.22%
Mortgage Type
Purchase Money Mortgage
Create a Home Valuation Report for This Property
The Home Valuation Report is an in-depth analysis detailing your home's value as well as a comparison with similar homes in the area
Home Values in the Area
Average Home Value in this Area
Purchase History
| Date | Buyer | Sale Price | Title Company |
|---|---|---|---|
| Regan Paul J | $171,350 | -- |
Source: Public Records
Mortgage History
| Date | Status | Borrower | Loan Amount |
|---|---|---|---|
| Open | Regan Paul J | $87,200 | |
| Closed | Regan Paul J | $105,000 | |
| Previous Owner | Regan Paul J | $90,000 |
Source: Public Records
Tax History
| Year | Tax Paid | Tax Assessment Tax Assessment Total Assessment is a certain percentage of the fair market value that is determined by local assessors to be the total taxable value of land and additions on the property. | Land | Improvement |
|---|---|---|---|---|
| 2025 | $8,232 | $688,300 | $435,700 | $252,600 |
| 2024 | $7,970 | $650,100 | $410,000 | $240,100 |
| 2023 | $7,901 | $625,100 | $393,700 | $231,400 |
| 2022 | $7,644 | $573,000 | $357,000 | $216,000 |
| 2021 | $9,756 | $536,400 | $336,600 | $199,800 |
| 2020 | $4,208 | $521,100 | $321,300 | $199,800 |
| 2019 | $9,305 | $521,100 | $321,300 | $199,800 |
| 2018 | $6,209 | $475,800 | $306,000 | $169,800 |
| 2017 | $4,652 | $429,200 | $262,500 | $166,700 |
| 2016 | $5,518 | $406,600 | $241,500 | $165,100 |
| 2015 | $5,431 | $393,000 | $241,500 | $151,500 |
Source: Public Records
Map
Nearby Homes
- 1 Fern St
- 28 Sylvester Rd
- 79 Speen St
- 16 West St
- 62 Oakland St
- 5 Lanes End
- 46 Silver Hill Ln Unit 1
- 25 Forest Ave
- 36 Silver Hill Ln Unit 21
- 26 Wellesley Ave Unit B
- 216-218 S Main St
- 3 Silver Hill Ln Unit 6
- 89 W Central St
- 1 Post Oak Ln Unit 19
- 7 Allison Way Unit 7
- 34 Walden Dr Unit 5
- 8 Walden Dr Unit 13
- 6 Floral Avenue Extension
- 11 Morgan Dr Unit 404
- 58 W Central St
Your Personal Tour Guide
Ask me questions while you tour the home.