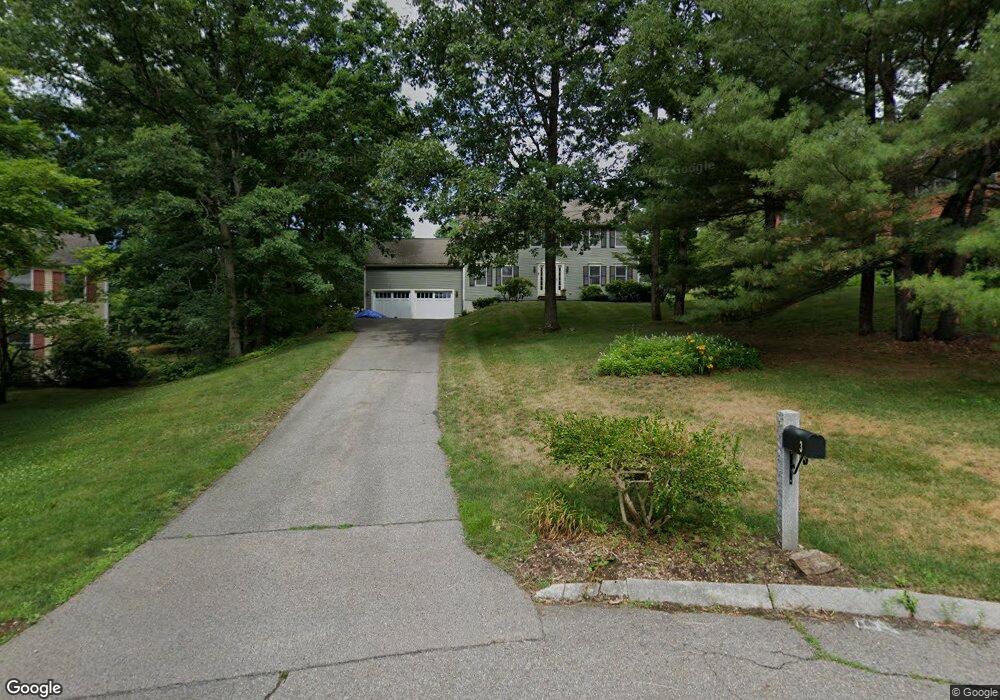
3 Wolfe Terrace Natick, MA 01760
Estimated Value: $1,097,393 - $1,524,000
4
Beds
3
Baths
2,240
Sq Ft
$588/Sq Ft
Est. Value
About This Home
This home is located at 3 Wolfe Terrace, Natick, MA 01760 and is currently estimated at $1,316,098, approximately $587 per square foot. 3 Wolfe Terrace is a home located in Middlesex County with nearby schools including Natick High School, Memorial Elementary School, and J F Kennedy Middle School.
Ownership History
Date
Name
Owned For
Owner Type
Purchase Details
Closed on
Sep 21, 1994
Sold by
Guigli Rubin Assoc
Bought by
Schelleng David H and Schelleng Amy W
Current Estimated Value
Home Financials for this Owner
Home Financials are based on the most recent Mortgage that was taken out on this home.
Original Mortgage
$225,600
Interest Rate
8.56%
Mortgage Type
Purchase Money Mortgage
Create a Home Valuation Report for This Property
The Home Valuation Report is an in-depth analysis detailing your home's value as well as a comparison with similar homes in the area
Home Values in the Area
Average Home Value in this Area
Purchase History
| Date | Buyer | Sale Price | Title Company |
|---|---|---|---|
| Schelleng David H | $317,150 | -- |
Source: Public Records
Mortgage History
| Date | Status | Borrower | Loan Amount |
|---|---|---|---|
| Open | Schelleng David H | $300,000 | |
| Closed | Schelleng David H | $239,000 | |
| Closed | Schelleng David H | $240,000 | |
| Closed | Schelleng David H | $225,600 |
Source: Public Records
Tax History
| Year | Tax Paid | Tax Assessment Tax Assessment Total Assessment is a certain percentage of the fair market value that is determined by local assessors to be the total taxable value of land and additions on the property. | Land | Improvement |
|---|---|---|---|---|
| 2025 | $12,374 | $1,034,600 | $469,600 | $565,000 |
| 2024 | $12,001 | $978,900 | $443,600 | $535,300 |
| 2023 | $11,117 | $879,500 | $415,700 | $463,800 |
| 2022 | $10,957 | $821,400 | $377,700 | $443,700 |
| 2021 | $10,484 | $770,300 | $357,000 | $413,300 |
| 2020 | $10,273 | $754,800 | $341,500 | $413,300 |
| 2019 | $9,594 | $754,800 | $341,500 | $413,300 |
| 2018 | $9,373 | $718,200 | $326,000 | $392,200 |
| 2017 | $9,161 | $679,100 | $294,100 | $385,000 |
| 2016 | $9,050 | $666,900 | $285,400 | $381,500 |
| 2015 | $8,776 | $635,000 | $285,400 | $349,600 |
Source: Public Records
Map
Nearby Homes
- 14 Pinewood Ave
- 216-218 S Main St
- 75 Cottage St
- 62 Oakland St
- 6 Floral Avenue Extension
- 30 Sienna Ln Unit 30
- 12 Floral Ave
- 25 Forest Ave
- 16 West St
- 16 Wayside Rd Unit 14
- 7 Allison Way Unit 7
- 5 Reynolds Ave Unit 2
- 2 Chester St
- 4 Chester St
- 63 Pond St
- 11 Morgan Dr Unit 404
- 17 Morgan Dr Unit 401
- 13 Morgan Dr Unit 109
- 7 High St
- 11 Avon St
Your Personal Tour Guide
Ask me questions while you tour the home.