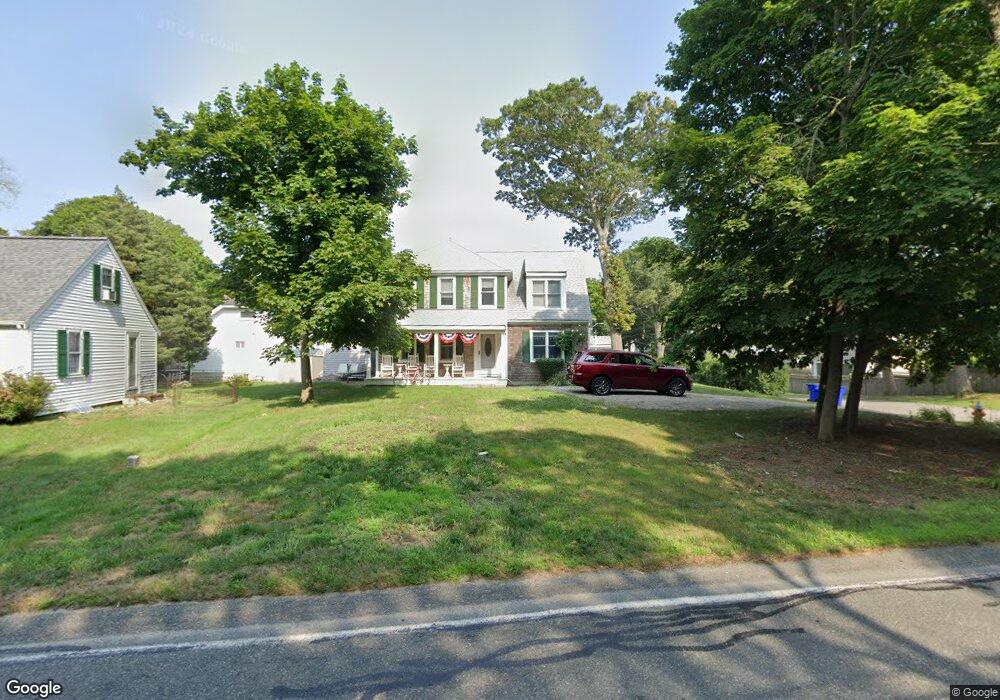
3 Wyman Ave Bourne, MA 02532
Monument Beach NeighborhoodEstimated Value: $437,000 - $715,000
3
Beds
2
Baths
1,799
Sq Ft
$340/Sq Ft
Est. Value
About This Home
This home is located at 3 Wyman Ave, Bourne, MA 02532 and is currently estimated at $612,432, approximately $340 per square foot. 3 Wyman Ave is a home located in Barnstable County with nearby schools including Bourne High School, St Margaret Regional School, and Cadence Academy Preschool - Bourne.
Ownership History
Date
Name
Owned For
Owner Type
Purchase Details
Closed on
May 23, 2014
Sold by
Jp Morgan Chase Bank N
Bought by
Hunter Charles R and Hunter Kristine L
Current Estimated Value
Purchase Details
Closed on
Oct 11, 2013
Sold by
Romero Richard and Jp Morgan Spec Mtg Llc
Bought by
Jp Morgan Chase Bank N
Purchase Details
Closed on
Dec 3, 1999
Sold by
Gauley Melvin G
Bought by
Romero Richard
Purchase Details
Closed on
Apr 22, 1997
Sold by
Est Peck Wilfred C and King John H
Bought by
Melvin Seth Rt and Gauley Melvin G
Create a Home Valuation Report for This Property
The Home Valuation Report is an in-depth analysis detailing your home's value as well as a comparison with similar homes in the area
Home Values in the Area
Average Home Value in this Area
Purchase History
| Date | Buyer | Sale Price | Title Company |
|---|---|---|---|
| Hunter Charles R | $150,000 | -- | |
| Hunter Charles R | $150,000 | -- | |
| Hunter Charles R | $150,000 | -- | |
| Jp Morgan Chase Bank N | $225,388 | -- | |
| Jp Morgan Chase Bank N | $225,388 | -- | |
| Romero Richard | $150,000 | -- | |
| Romero Richard | $150,000 | -- | |
| Melvin Seth Rt | $32,500 | -- | |
| Melvin Seth Rt | $32,500 | -- |
Source: Public Records
Mortgage History
| Date | Status | Borrower | Loan Amount |
|---|---|---|---|
| Previous Owner | Melvin Seth Rt | $310,400 | |
| Previous Owner | Melvin Seth Rt | $223,012 |
Source: Public Records
Tax History
| Year | Tax Paid | Tax Assessment Tax Assessment Total Assessment is a certain percentage of the fair market value that is determined by local assessors to be the total taxable value of land and additions on the property. | Land | Improvement |
|---|---|---|---|---|
| 2025 | $4,217 | $539,900 | $216,100 | $323,800 |
| 2024 | $4,150 | $517,500 | $205,800 | $311,700 |
| 2023 | $4,061 | $460,900 | $182,100 | $278,800 |
| 2022 | $3,989 | $395,300 | $174,100 | $221,200 |
| 2021 | $3,898 | $361,900 | $158,400 | $203,500 |
| 2020 | $3,798 | $353,600 | $156,900 | $196,700 |
| 2019 | $3,565 | $339,200 | $156,900 | $182,300 |
| 2018 | $3,127 | $296,700 | $149,500 | $147,200 |
| 2017 | $2,988 | $290,100 | $142,600 | $147,500 |
| 2016 | $2,910 | $286,400 | $142,600 | $143,800 |
| 2015 | $2,884 | $286,400 | $142,600 | $143,800 |
Source: Public Records
Map
Nearby Homes
- 566 Shore Rd
- 10 Howard Ave
- 10 Howard Ave
- 203 County Rd
- 35 Benedict Rd
- 16 Amberwood Ct
- 14 Navajo Rd
- 13 Laurel Hill Ct
- 12 Turnberry Rd Unit 12
- 5 Harbor Hill Dr
- 4 Harbor Hill Dr
- 20 Colony Ave
- 2 Applewood Ct
- 5 Sea Knoll Ct
- 5 Zoli Ln
- 4 Hollyhock Knoll Ct Unit 4
- 4 Hollyhock Knoll Ct Unit 4
- 709 County Rd
- 254 Barlows Landing Rd
- 3 1st St
Your Personal Tour Guide
Ask me questions while you tour the home.