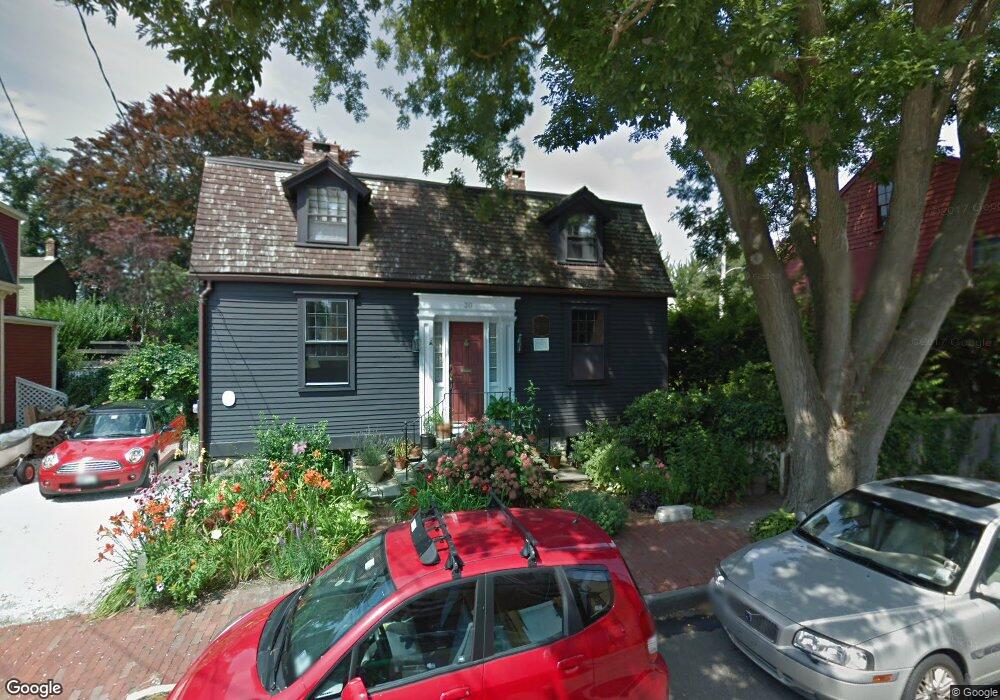
30 2nd St Newport, RI 02840
Estimated Value: $1,147,000 - $1,520,000
3
Beds
3
Baths
1,616
Sq Ft
$847/Sq Ft
Est. Value
About This Home
This home is located at 30 2nd St, Newport, RI 02840 and is currently estimated at $1,369,071, approximately $847 per square foot. 30 2nd St is a home located in Newport County with nearby schools including Rogers High School, St Michael's Country Day School, and St George's School.
Ownership History
Date
Name
Owned For
Owner Type
Purchase Details
Closed on
May 31, 2024
Sold by
Conroy Michael L and Conroy Trudence J
Bought by
Michael L & Trudence J Co and Conroy
Current Estimated Value
Purchase Details
Closed on
May 25, 2006
Sold by
Gill Sarah J
Bought by
Conroy Trudence and Conroy Michael
Home Financials for this Owner
Home Financials are based on the most recent Mortgage that was taken out on this home.
Original Mortgage
$468,000
Interest Rate
6.53%
Mortgage Type
Purchase Money Mortgage
Purchase Details
Closed on
Jan 4, 1999
Sold by
Fleer Karen D and Fleer Florence D
Bought by
Gill Anthony and Gill Sarah
Purchase Details
Closed on
Mar 2, 1998
Sold by
Weaver Judith Ann and Sittler Wiley David
Bought by
Fleer Florence D and Fleer Karen D
Purchase Details
Closed on
Feb 16, 1993
Sold by
Tamburro Donald J and Bates Elizabeth
Bought by
Weaver Judith Ann and Sittler Wiley David
Create a Home Valuation Report for This Property
The Home Valuation Report is an in-depth analysis detailing your home's value as well as a comparison with similar homes in the area
Home Values in the Area
Average Home Value in this Area
Purchase History
| Date | Buyer | Sale Price | Title Company |
|---|---|---|---|
| Michael L & Trudence J Co | -- | None Available | |
| Michael L & Trudence J Co | -- | None Available | |
| Conroy Trudence | $585,000 | -- | |
| Gill Anthony | $315,000 | -- | |
| Fleer Florence D | $245,000 | -- | |
| Conroy Trudence | $585,000 | -- | |
| Gill Anthony | $315,000 | -- | |
| Fleer Florence D | $245,000 | -- | |
| Weaver Judith Ann | $215,000 | -- |
Source: Public Records
Mortgage History
| Date | Status | Borrower | Loan Amount |
|---|---|---|---|
| Previous Owner | Weaver Judith Ann | $468,000 | |
| Previous Owner | Weaver Judith Ann | $87,750 |
Source: Public Records
Tax History Compared to Growth
Tax History
| Year | Tax Paid | Tax Assessment Tax Assessment Total Assessment is a certain percentage of the fair market value that is determined by local assessors to be the total taxable value of land and additions on the property. | Land | Improvement |
|---|---|---|---|---|
| 2025 | $11,539 | $1,328,000 | $459,900 | $868,100 |
| 2024 | $10,916 | $1,328,000 | $459,900 | $868,100 |
| 2023 | $8,535 | $860,400 | $302,800 | $557,600 |
| 2022 | $8,268 | $860,400 | $302,800 | $557,600 |
| 2021 | $8,028 | $860,400 | $302,800 | $557,600 |
| 2020 | $7,216 | $701,900 | $282,600 | $419,300 |
| 2019 | $7,216 | $701,900 | $282,600 | $419,300 |
| 2018 | $7,012 | $701,900 | $282,600 | $419,300 |
| 2017 | $6,519 | $581,500 | $217,200 | $364,300 |
| 2016 | $6,356 | $581,500 | $217,200 | $364,300 |
| 2015 | $6,205 | $581,500 | $217,200 | $364,300 |
| 2014 | $6,430 | $533,200 | $169,800 | $363,400 |
Source: Public Records
Map
Nearby Homes
- 35 Second St
- 43 Poplar St
- 0 Second St
- 23 Willow St
- 11 Willow St Unit 5
- 12 Poplar St
- 7 Cozzens Ct
- 74 Third St
- 31 Coddington St Unit 24
- 17 Warner St
- 104 Second St
- 27 Soar Way
- 69 Spring St
- 102 Broadway Unit 2B
- 87 Spring St
- 5 Bowser Ct
- 10 Barney St Unit 102
- 10 Barney St Unit 107
- 10 Barney St Unit 101
- 10 Barney St Unit U106