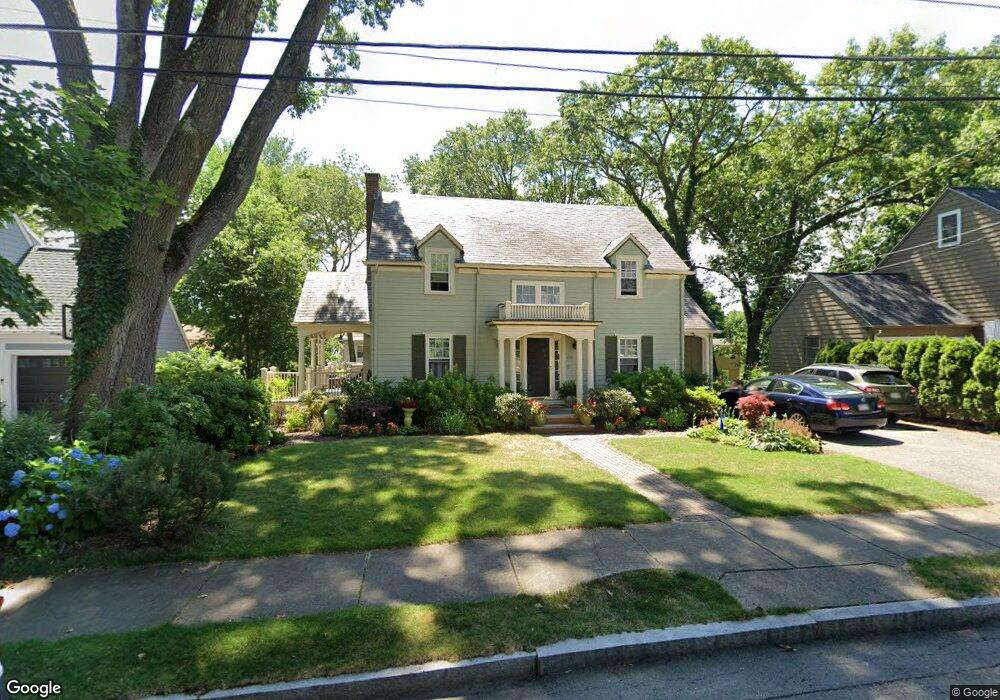
30 Alexander Rd Newton Highlands, MA 02461
Newton Highlands NeighborhoodEstimated Value: $1,415,000 - $1,660,033
3
Beds
3
Baths
2,450
Sq Ft
$633/Sq Ft
Est. Value
About This Home
This home is located at 30 Alexander Rd, Newton Highlands, MA 02461 and is currently estimated at $1,549,758, approximately $632 per square foot. 30 Alexander Rd is a home located in Middlesex County with nearby schools including Countryside Elementary School, Charles E Brown Middle School, and Newton South High School.
Ownership History
Date
Name
Owned For
Owner Type
Purchase Details
Closed on
Jul 1, 1984
Bought by
Mcgeary Patrick J and Mcgeary Rita M
Current Estimated Value
Create a Home Valuation Report for This Property
The Home Valuation Report is an in-depth analysis detailing your home's value as well as a comparison with similar homes in the area
Home Values in the Area
Average Home Value in this Area
Purchase History
| Date | Buyer | Sale Price | Title Company |
|---|---|---|---|
| Mcgeary Patrick J | $140,000 | -- |
Source: Public Records
Mortgage History
| Date | Status | Borrower | Loan Amount |
|---|---|---|---|
| Open | Mcgeary Patrick J | $50,000 | |
| Closed | Mcgeary Patrick J | $20,000 | |
| Closed | Mcgeary Patrick J | $160,000 | |
| Closed | Mcgeary Patrick J | $153,000 |
Source: Public Records
Tax History Compared to Growth
Tax History
| Year | Tax Paid | Tax Assessment Tax Assessment Total Assessment is a certain percentage of the fair market value that is determined by local assessors to be the total taxable value of land and additions on the property. | Land | Improvement |
|---|---|---|---|---|
| 2025 | $13,467 | $1,374,200 | $844,400 | $529,800 |
| 2024 | $13,022 | $1,334,200 | $819,800 | $514,400 |
| 2023 | $12,276 | $1,205,900 | $618,100 | $587,800 |
| 2022 | $11,747 | $1,116,600 | $572,300 | $544,300 |
| 2021 | $11,335 | $1,053,400 | $539,900 | $513,500 |
| 2020 | $10,997 | $1,053,400 | $539,900 | $513,500 |
| 2019 | $10,687 | $1,022,700 | $524,200 | $498,500 |
| 2018 | $10,244 | $946,800 | $480,500 | $466,300 |
| 2017 | $9,932 | $893,200 | $453,300 | $439,900 |
| 2016 | $9,500 | $834,800 | $423,600 | $411,200 |
| 2015 | $9,058 | $780,200 | $395,900 | $384,300 |
Source: Public Records
Map
Nearby Homes
- 19 Selwyn Rd
- 250 Woodcliff Rd
- 125 Oakdale Rd
- 1308 Walnut St
- 671 Boylston St
- 628 Boylston St
- 1292 Walnut St
- 36 Cannon St
- 21 Philbrick Rd
- 625 Boylston St
- 42 Sunhill Ln
- 35 Haynes Rd
- 45 Brandeis Rd
- 1623-1625 Centre St
- 1629 Centre St
- 1597 Centre St Unit 1597
- 1597 Centre St
- 116 Upland Ave
- 5 Halcyon Rd
- 15 Buff Cir