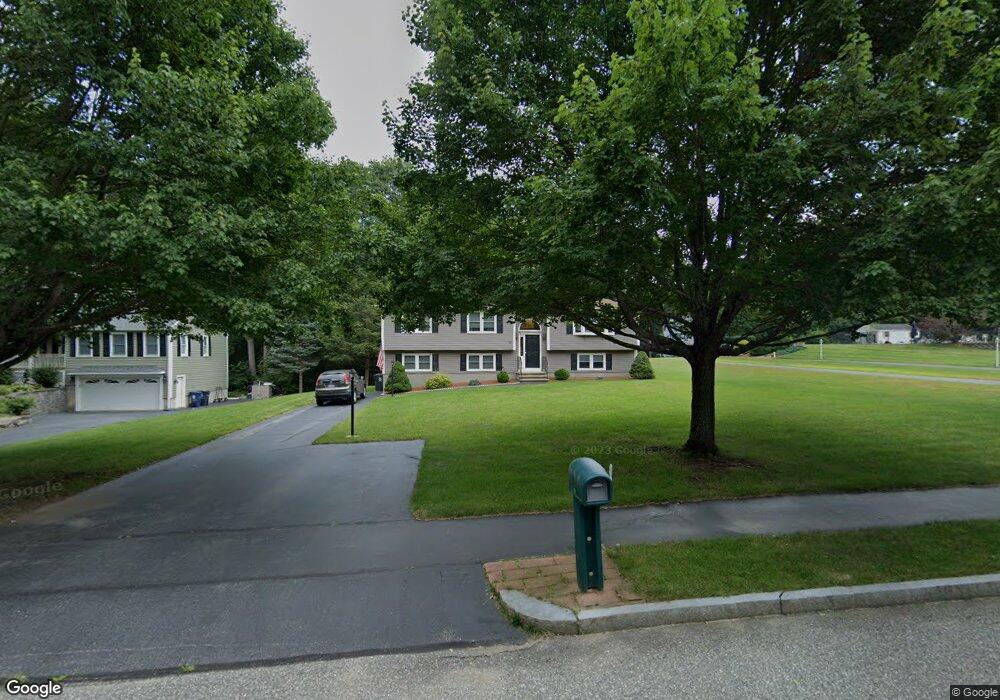
30 Apache Way Wilmington, MA 01887
Estimated Value: $767,269 - $888,000
3
Beds
2
Baths
1,244
Sq Ft
$656/Sq Ft
Est. Value
About This Home
This home is located at 30 Apache Way, Wilmington, MA 01887 and is currently estimated at $816,567, approximately $656 per square foot. 30 Apache Way is a home located in Middlesex County with nearby schools including Wilmington Middle School, Wilmington High School, and Abundant Life Christian School and Childcare.
Ownership History
Date
Name
Owned For
Owner Type
Purchase Details
Closed on
Oct 9, 2024
Sold by
Tamburello Angelo and Tamburello Jody M
Bought by
Tamburello
Current Estimated Value
Purchase Details
Closed on
Apr 10, 1996
Sold by
Northeastern Dev Corp
Bought by
Tamburello Angelo
Home Financials for this Owner
Home Financials are based on the most recent Mortgage that was taken out on this home.
Original Mortgage
$125,000
Interest Rate
7.39%
Mortgage Type
Purchase Money Mortgage
Create a Home Valuation Report for This Property
The Home Valuation Report is an in-depth analysis detailing your home's value as well as a comparison with similar homes in the area
Purchase History
| Date | Buyer | Sale Price | Title Company |
|---|---|---|---|
| Tamburello | -- | None Available | |
| Tamburello | -- | None Available | |
| Tamburello Angelo | $214,900 | -- | |
| Tamburello Angelo | $214,900 | -- |
Source: Public Records
Mortgage History
| Date | Status | Borrower | Loan Amount |
|---|---|---|---|
| Previous Owner | Tamburello Angelo | $125,000 |
Source: Public Records
Tax History
| Year | Tax Paid | Tax Assessment Tax Assessment Total Assessment is a certain percentage of the fair market value that is determined by local assessors to be the total taxable value of land and additions on the property. | Land | Improvement |
|---|---|---|---|---|
| 2025 | $8,176 | $714,100 | $344,600 | $369,500 |
| 2024 | $8,118 | $710,200 | $344,600 | $365,600 |
| 2023 | $7,595 | $636,100 | $292,400 | $343,700 |
| 2022 | $7,009 | $537,900 | $243,600 | $294,300 |
| 2021 | $6,896 | $498,300 | $221,400 | $276,900 |
| 2020 | $6,960 | $512,500 | $221,400 | $291,100 |
| 2019 | $6,502 | $472,900 | $216,500 | $256,400 |
| 2018 | $6,123 | $424,900 | $206,300 | $218,600 |
| 2017 | $6,023 | $416,800 | $206,300 | $210,500 |
| 2016 | $5,753 | $393,200 | $196,500 | $196,700 |
| 2015 | $5,486 | $381,800 | $196,500 | $185,300 |
| 2014 | $5,165 | $362,700 | $187,200 | $175,500 |
Source: Public Records
Map
Nearby Homes
- 6 Patricia Cir
- 224 Burlington Ave
- 255 Burlington Ave
- 3 Clark Terrace
- 56 Grove Ave
- 31 Burlington Ave
- 3 Sarafina's Way
- 44 Connolly Rd
- 3 Memory Ln
- 6 Glade St
- 35 Oak St
- 50 Glenwood Rd
- 9 Parker St
- 95 Bellflower Rd
- 7 Cross St Unit 303
- 7 Cross St Unit 304
- 7 Cross St Unit 205
- 7 Cross St Unit 102
- 29 Beaverbrook Rd
- 11 Bicknell Rd
Your Personal Tour Guide
Ask me questions while you tour the home.