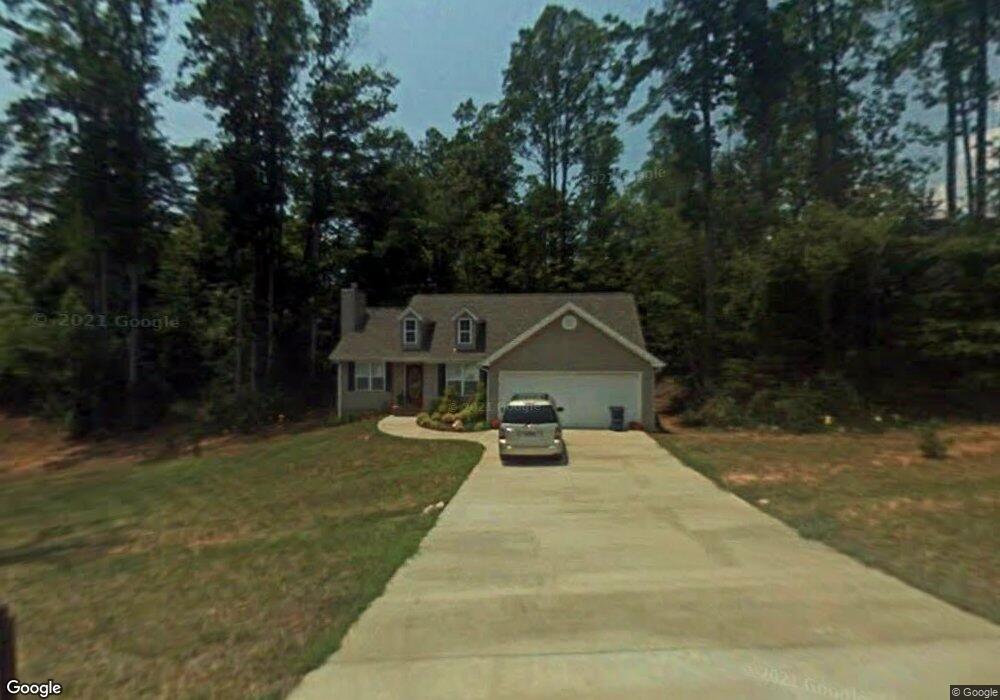
30 Ascot Dr Cleveland, GA 30528
Estimated Value: $333,175 - $344,000
3
Beds
2
Baths
1,356
Sq Ft
$251/Sq Ft
Est. Value
About This Home
This home is located at 30 Ascot Dr, Cleveland, GA 30528 and is currently estimated at $340,544, approximately $251 per square foot. 30 Ascot Dr is a home located in White County with nearby schools including White County 9th Grade Academy, Tesnatee Gap Elementary (Old White County Intermediate), and Jack P. Nix Elementary School.
Ownership History
Date
Name
Owned For
Owner Type
Purchase Details
Closed on
Jun 14, 2023
Sold by
Cantrell Roger Raymond
Bought by
Kelley Michael S
Current Estimated Value
Home Financials for this Owner
Home Financials are based on the most recent Mortgage that was taken out on this home.
Original Mortgage
$307,500
Outstanding Balance
$298,950
Interest Rate
6.39%
Mortgage Type
New Conventional
Estimated Equity
$41,594
Purchase Details
Closed on
Jul 18, 2016
Sold by
Royal Nancy W
Bought by
Cantrell Roger Raymond and Cantrell Angela Christine
Home Financials for this Owner
Home Financials are based on the most recent Mortgage that was taken out on this home.
Original Mortgage
$107,025
Interest Rate
3.5%
Mortgage Type
FHA
Purchase Details
Closed on
Nov 29, 2005
Sold by
Hollander Jay
Bought by
Royal Nancy W
Create a Home Valuation Report for This Property
The Home Valuation Report is an in-depth analysis detailing your home's value as well as a comparison with similar homes in the area
Home Values in the Area
Average Home Value in this Area
Purchase History
| Date | Buyer | Sale Price | Title Company |
|---|---|---|---|
| Kelley Michael S | $328,000 | -- | |
| Cantrell Roger Raymond | $109,000 | -- | |
| Royal Nancy W | $125,900 | -- |
Source: Public Records
Mortgage History
| Date | Status | Borrower | Loan Amount |
|---|---|---|---|
| Open | Kelley Michael S | $307,500 | |
| Previous Owner | Cantrell Roger Raymond | $107,025 |
Source: Public Records
Tax History Compared to Growth
Tax History
| Year | Tax Paid | Tax Assessment Tax Assessment Total Assessment is a certain percentage of the fair market value that is determined by local assessors to be the total taxable value of land and additions on the property. | Land | Improvement |
|---|---|---|---|---|
| 2025 | $2,580 | $112,148 | $12,000 | $100,148 |
| 2024 | $2,580 | $112,148 | $12,000 | $100,148 |
| 2023 | $2,172 | $78,296 | $10,000 | $68,296 |
| 2022 | $1,979 | $68,744 | $9,600 | $59,144 |
| 2021 | $1,892 | $57,800 | $9,600 | $48,200 |
| 2020 | $1,735 | $50,924 | $9,600 | $41,324 |
| 2019 | $1,743 | $50,924 | $9,600 | $41,324 |
| 2018 | $1,688 | $49,324 | $8,000 | $41,324 |
| 2017 | $1,438 | $43,600 | $7,580 | $36,020 |
| 2016 | $1,223 | $47,080 | $8,000 | $39,080 |
| 2015 | $1,178 | $117,700 | $8,000 | $39,080 |
| 2014 | $1,046 | $108,980 | $0 | $0 |
Source: Public Records
Map
Nearby Homes
- 0 W Kytle St Unit 10623685
- 62 North Ave
- 230 Campbell St
- 232 Campbell St
- 00 Helton Rd
- 53 Jackson Cir
- LOT 5 Stacey Dr
- 187 Helton Rd
- 0 Townview Dr Unit 10495967
- 165 Jackson Heights Unit 1
- 171 Jackson Heights Unit 2
- 171 Jackson Heights
- 177 Jackson Heights
- 183 Jackson Heights Unit 4
- 183 Jackson Heights
- 93 Colonial Dr
- 915 Holiness
- 189 Jackson Heights
- 189 Jackson Heights Unit 5
- 201 Jackson Heights Unit 7
- 14 Ascot Dr
- 76 Ascot Dr
- 64 Kensington Dr
- 64 Kensington Dr
- 0 Kensington Ln Unit 8177708
- 0 Kensington Ln Unit 8715003
- 0 Kensington Ln
- 39 Ascot Dr
- 0 Ascot Dr Unit 17 3280819
- 0 Ascot Dr Unit 7092397
- 0 Ascot Dr Unit 7128027
- 11 Ascot Dr
- 103 Kensington Dr
- 50 Kensington Ln
- 73 Kensington Dr
- 117 Kensington Dr
- 88 Ascot Dr
- 33 Berkshire Dr
- 63 Kensington Dr
- 156 Kensington Dr