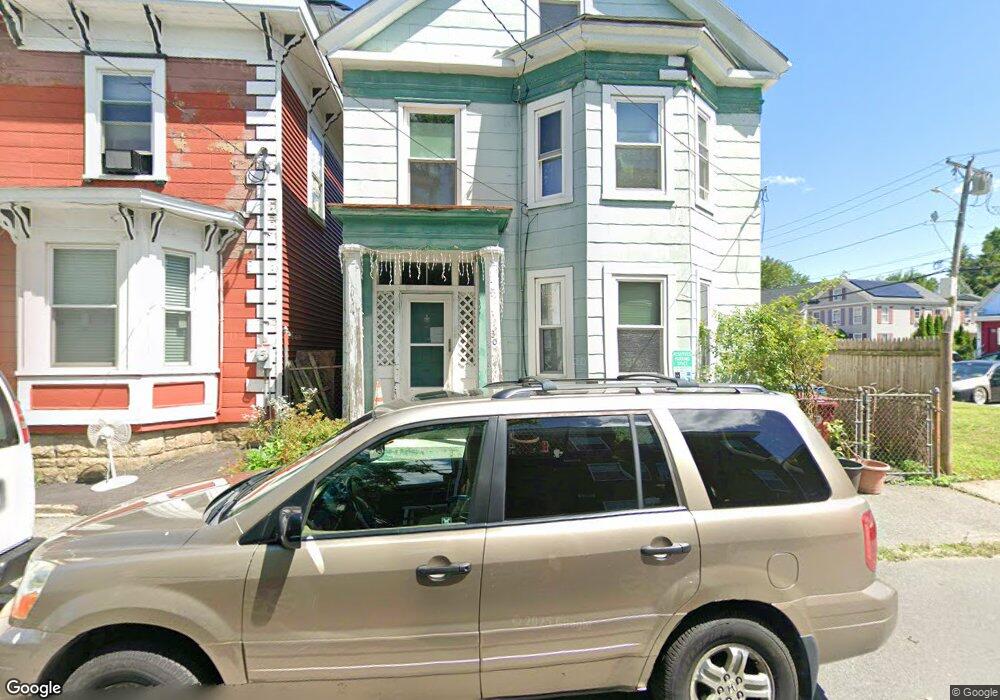
30 Ash St Lowell, MA 01852
Lower Belvidere NeighborhoodEstimated Value: $480,445 - $666,000
4
Beds
2
Baths
2,364
Sq Ft
$237/Sq Ft
Est. Value
About This Home
This home is located at 30 Ash St, Lowell, MA 01852 and is currently estimated at $561,361, approximately $237 per square foot. 30 Ash St is a home located in Middlesex County with nearby schools including Moody Elementary School, Greenhalge Elementary School, and Abraham Lincoln Elementary School.
Ownership History
Date
Name
Owned For
Owner Type
Purchase Details
Closed on
Apr 4, 2011
Sold by
Britto Mark P
Bought by
Lowell City Of
Current Estimated Value
Purchase Details
Closed on
Mar 14, 2003
Sold by
Brito Madeline and Britto Madeline
Bought by
Britto Mark P
Purchase Details
Closed on
Jul 15, 1994
Sold by
Shawmut Mtg Co
Bought by
Britto Mancos and Britto Madeline
Home Financials for this Owner
Home Financials are based on the most recent Mortgage that was taken out on this home.
Original Mortgage
$26,550
Interest Rate
8.51%
Mortgage Type
Purchase Money Mortgage
Purchase Details
Closed on
Mar 9, 1993
Sold by
Fohlin Mary B
Bought by
Federal National Mortgage Association
Create a Home Valuation Report for This Property
The Home Valuation Report is an in-depth analysis detailing your home's value as well as a comparison with similar homes in the area
Home Values in the Area
Average Home Value in this Area
Purchase History
| Date | Buyer | Sale Price | Title Company |
|---|---|---|---|
| Lowell City Of | $911 | -- | |
| Lowell City Of | $911 | -- | |
| Britto Mark P | -- | -- | |
| Britto Mark P | -- | -- | |
| Britto Mancos | $29,500 | -- | |
| Britto Mancos | $29,500 | -- | |
| Federal National Mortgage Association | $58,500 | -- | |
| Federal National Mortgage Association | $58,500 | -- |
Source: Public Records
Mortgage History
| Date | Status | Borrower | Loan Amount |
|---|---|---|---|
| Previous Owner | Federal National Mortgage Association | $26,550 |
Source: Public Records
Tax History
| Year | Tax Paid | Tax Assessment Tax Assessment Total Assessment is a certain percentage of the fair market value that is determined by local assessors to be the total taxable value of land and additions on the property. | Land | Improvement |
|---|---|---|---|---|
| 2025 | $4,990 | $434,700 | $92,700 | $342,000 |
| 2024 | $4,681 | $393,000 | $90,800 | $302,200 |
| 2023 | $4,354 | $350,600 | $78,900 | $271,700 |
| 2022 | $3,916 | $308,600 | $62,800 | $245,800 |
| 2021 | $3,632 | $269,800 | $54,600 | $215,200 |
| 2020 | $3,408 | $255,100 | $56,700 | $198,400 |
| 2019 | $3,276 | $233,300 | $56,500 | $176,800 |
| 2018 | $3,052 | $212,100 | $53,800 | $158,300 |
| 2017 | $2,886 | $193,400 | $48,900 | $144,500 |
| 2016 | $2,855 | $188,300 | $43,800 | $144,500 |
| 2015 | $2,629 | $169,800 | $43,800 | $126,000 |
| 2013 | $2,265 | $150,900 | $50,700 | $100,200 |
Source: Public Records
Map
Nearby Homes
- 158 Concord St
- 88 Perry St
- 189 Charles St
- 10 Kearney Square Unit 407
- 39 Groves Ave
- 192 1st St
- 94 1st St Unit 10
- 8 Cady St
- 25 Read St
- 105 3rd St
- 3 Vernon St
- 9 Central St Unit 601
- 9 Central St Unit 602
- 234 Nesmith St Unit 8
- 23-33 Middle St Unit 6
- 23-33 Middle St Unit 21
- 61 Market St Unit 2B
- 44 Hanks St
- 200 Rogers St Unit 6
- 130 John St Unit 350
Your Personal Tour Guide
Ask me questions while you tour the home.