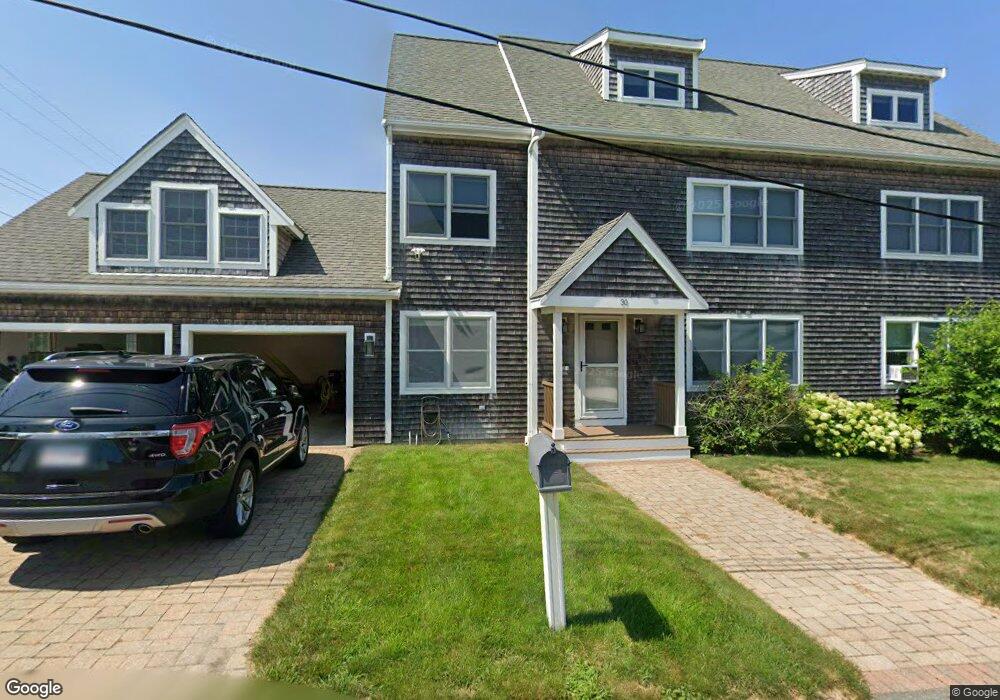
30 Atlantic St Marshfield, MA 02050
Ocean Bluff-Brant Rock NeighborhoodEstimated Value: $907,000 - $1,457,955
3
Beds
3
Baths
3,436
Sq Ft
$333/Sq Ft
Est. Value
About This Home
This home is located at 30 Atlantic St, Marshfield, MA 02050 and is currently estimated at $1,143,989, approximately $332 per square foot. 30 Atlantic St is a home located in Plymouth County with nearby schools including Daniel Webster, Furnace Brook Middle School, and Marshfield High School.
Ownership History
Date
Name
Owned For
Owner Type
Purchase Details
Closed on
Oct 17, 1997
Sold by
Bianchi Edward
Bought by
Murphy John L and Murphy Paula M
Current Estimated Value
Home Financials for this Owner
Home Financials are based on the most recent Mortgage that was taken out on this home.
Original Mortgage
$110,000
Interest Rate
7.46%
Mortgage Type
Purchase Money Mortgage
Purchase Details
Closed on
May 27, 1993
Sold by
Webster Ann H and Mijares Carolyn P
Bought by
Rice Charlotte T
Purchase Details
Closed on
Sep 19, 1990
Sold by
Giles James W
Bought by
Hersey Marie C
Home Financials for this Owner
Home Financials are based on the most recent Mortgage that was taken out on this home.
Original Mortgage
$117,000
Interest Rate
9.89%
Mortgage Type
Purchase Money Mortgage
Create a Home Valuation Report for This Property
The Home Valuation Report is an in-depth analysis detailing your home's value as well as a comparison with similar homes in the area
Home Values in the Area
Average Home Value in this Area
Purchase History
| Date | Buyer | Sale Price | Title Company |
|---|---|---|---|
| Murphy John L | $185,000 | -- | |
| Rice Charlotte T | $175,000 | -- | |
| Hersey Marie C | $168,000 | -- |
Source: Public Records
Mortgage History
| Date | Status | Borrower | Loan Amount |
|---|---|---|---|
| Open | Hersey Marie C | $345,500 | |
| Closed | Hersey Marie C | $350,000 | |
| Closed | Hersey Marie C | $110,000 | |
| Previous Owner | Hersey Marie C | $117,000 |
Source: Public Records
Tax History Compared to Growth
Tax History
| Year | Tax Paid | Tax Assessment Tax Assessment Total Assessment is a certain percentage of the fair market value that is determined by local assessors to be the total taxable value of land and additions on the property. | Land | Improvement |
|---|---|---|---|---|
| 2025 | $11,242 | $1,135,600 | $506,600 | $629,000 |
| 2024 | $10,597 | $1,019,900 | $452,300 | $567,600 |
| 2023 | $10,302 | $903,400 | $410,100 | $493,300 |
| 2022 | $10,302 | $795,500 | $371,900 | $423,600 |
| 2021 | $9,916 | $751,800 | $371,900 | $379,900 |
| 2020 | $9,260 | $694,700 | $325,700 | $369,000 |
| 2019 | $9,002 | $672,800 | $325,700 | $347,100 |
| 2018 | $8,348 | $624,400 | $281,400 | $343,000 |
| 2017 | $8,133 | $592,800 | $281,400 | $311,400 |
| 2016 | $7,731 | $557,000 | $267,400 | $289,600 |
| 2015 | $7,306 | $549,700 | $267,400 | $282,300 |
| 2014 | $7,341 | $552,400 | $267,400 | $285,000 |
Source: Public Records
Map
Nearby Homes