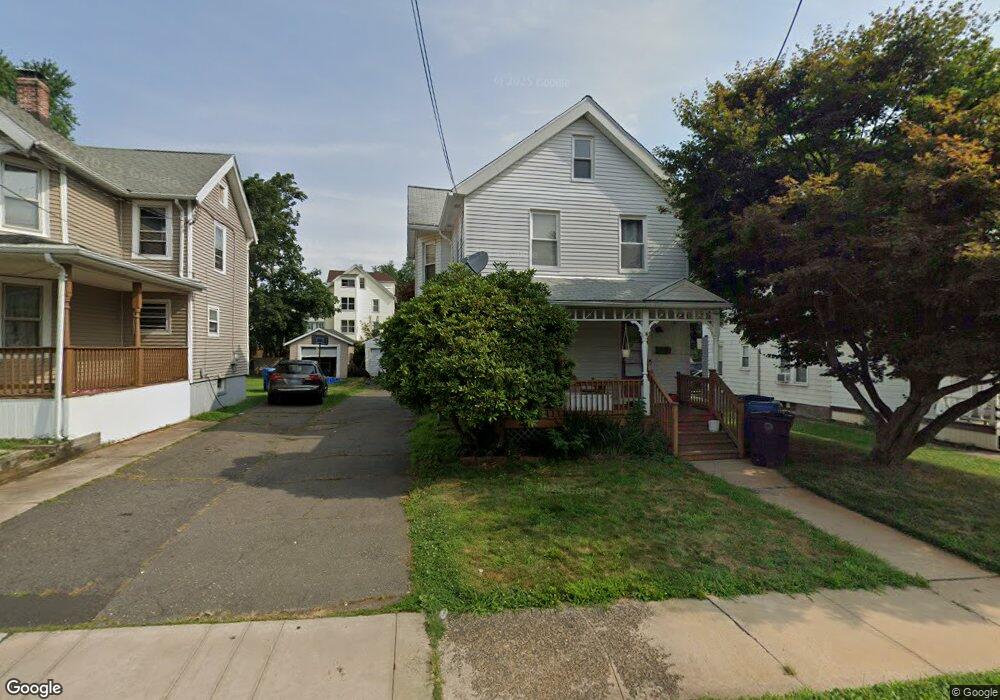
30 Belden St New Britain, CT 06051
Estimated Value: $257,000 - $280,054
3
Beds
1
Bath
1,310
Sq Ft
$206/Sq Ft
Est. Value
About This Home
This home is located at 30 Belden St, New Britain, CT 06051 and is currently estimated at $270,514, approximately $206 per square foot. 30 Belden St is a home located in Hartford County with nearby schools including Chamberlain School, Pulaski Middle School, and Emmanuel Christian Academy.
Ownership History
Date
Name
Owned For
Owner Type
Purchase Details
Closed on
May 11, 2007
Sold by
Cassella Michael J
Bought by
Isaacs Juanita S
Current Estimated Value
Home Financials for this Owner
Home Financials are based on the most recent Mortgage that was taken out on this home.
Original Mortgage
$162,450
Interest Rate
6.21%
Purchase Details
Closed on
Oct 24, 2005
Sold by
Clark Sarah J
Bought by
Cassella Michael J and Vernon Jessica
Create a Home Valuation Report for This Property
The Home Valuation Report is an in-depth analysis detailing your home's value as well as a comparison with similar homes in the area
Home Values in the Area
Average Home Value in this Area
Purchase History
| Date | Buyer | Sale Price | Title Company |
|---|---|---|---|
| Isaacs Juanita S | $165,000 | -- | |
| Cassella Michael J | $158,000 | -- |
Source: Public Records
Mortgage History
| Date | Status | Borrower | Loan Amount |
|---|---|---|---|
| Open | Cassella Michael J | $143,044 | |
| Closed | Cassella Michael J | $5,209 | |
| Closed | Cassella Michael J | $162,450 |
Source: Public Records
Tax History Compared to Growth
Tax History
| Year | Tax Paid | Tax Assessment Tax Assessment Total Assessment is a certain percentage of the fair market value that is determined by local assessors to be the total taxable value of land and additions on the property. | Land | Improvement |
|---|---|---|---|---|
| 2025 | $5,109 | $130,410 | $41,580 | $88,830 |
| 2024 | $5,163 | $130,410 | $41,580 | $88,830 |
| 2023 | $4,992 | $130,410 | $41,580 | $88,830 |
| 2022 | $4,262 | $86,100 | $19,180 | $66,920 |
| 2021 | $4,262 | $86,100 | $19,180 | $66,920 |
| 2020 | $4,348 | $86,100 | $19,180 | $66,920 |
| 2019 | $4,348 | $86,100 | $19,180 | $66,920 |
| 2018 | $4,348 | $86,100 | $19,180 | $66,920 |
| 2017 | $3,945 | $78,120 | $19,180 | $58,940 |
| 2016 | $3,945 | $78,120 | $19,180 | $58,940 |
| 2015 | $3,828 | $78,120 | $19,180 | $58,940 |
| 2014 | $3,828 | $78,120 | $19,180 | $58,940 |
Source: Public Records
Map
Nearby Homes