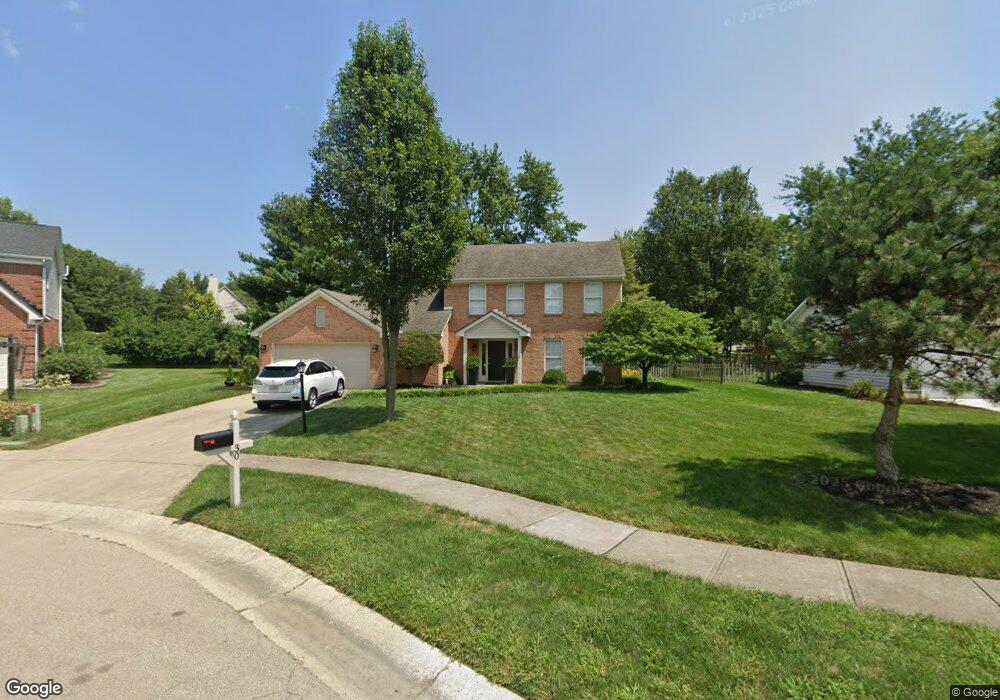
30 Bentbrook Ct Springboro, OH 45066
Clearcreek AreaEstimated Value: $351,000 - $406,000
3
Beds
3
Baths
1,758
Sq Ft
$217/Sq Ft
Est. Value
About This Home
This home is located at 30 Bentbrook Ct, Springboro, OH 45066 and is currently estimated at $380,609, approximately $216 per square foot. 30 Bentbrook Ct is a home located in Warren County with nearby schools including Clearcreek Elementary School, Springboro Intermediate School, and Springboro Junior High School.
Create a Home Valuation Report for This Property
The Home Valuation Report is an in-depth analysis detailing your home's value as well as a comparison with similar homes in the area
Home Values in the Area
Average Home Value in this Area
Tax History
We collect this data history from publicly available records. To have your information removed, we recommend requesting removal directly through your county’s website.
| Year | Tax Paid | Tax Assessment Tax Assessment Total Assessment is a certain percentage of the fair market value that is determined by local assessors to be the total taxable value of land and additions on the property. | Land | Improvement |
|---|---|---|---|---|
| 2025 | $3,891 | $99,630 | $31,500 | $68,130 |
| 2024 | $3,891 | $99,630 | $31,500 | $68,130 |
| 2023 | $3,305 | $77,609 | $17,220 | $60,389 |
| 2022 | $3,301 | $77,609 | $17,220 | $60,389 |
| 2021 | $3,075 | $77,609 | $17,220 | $60,389 |
| 2020 | $2,863 | $63,098 | $14,000 | $49,098 |
| 2019 | $2,643 | $63,098 | $14,000 | $49,098 |
| 2018 | $2,600 | $63,098 | $14,000 | $49,098 |
| 2017 | $2,567 | $56,095 | $13,167 | $42,928 |
| 2016 | $2,677 | $56,095 | $13,167 | $42,928 |
| 2015 | $2,574 | $56,095 | $13,167 | $42,928 |
| 2014 | $2,574 | $51,000 | $11,970 | $39,030 |
| 2013 | $2,572 | $59,640 | $14,000 | $45,640 |
Source: Public Records
Map
Nearby Homes
- 65 Ambridge Ct
- 35 Berryhill Ct
- 25 Fenwick Ct
- 1264 Normandy Rue
- 1247 Normandy Rue
- 660 W Lytle 5 Points Rd
- 9095 N Bunnell Hill Rd
- 65 Reed Rd
- 25 Huntley Ct
- 91 Hillcrest Dr
- 11 S Glen Oak Dr
- 9503 Gem Stone Dr
- 490 Clearsprings Dr
- 136 Waterhaven Way
- 127 Rippling Brook Ln
- 105 Sweetgum Ln
- 141 Old Pond Rd
- 16 Waterlily Dr
- 1576 Rockleigh Rd
- 398 Greystone Dr
Your Personal Tour Guide
Ask me questions while you tour the home.