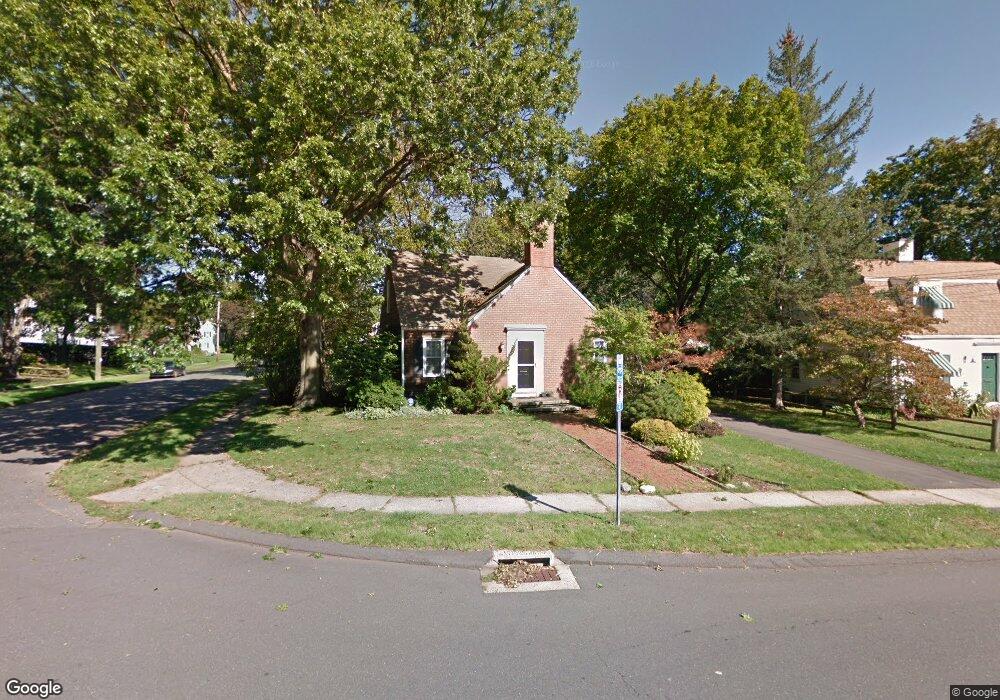
30 Boswell Rd West Hartford, CT 06107
Estimated Value: $434,000 - $523,000
3
Beds
2
Baths
1,570
Sq Ft
$295/Sq Ft
Est. Value
About This Home
This home is located at 30 Boswell Rd, West Hartford, CT 06107 and is currently estimated at $463,883, approximately $295 per square foot. 30 Boswell Rd is a home located in Hartford County with nearby schools including Webster Hill School, Sedgwick Middle School, and Conard High School.
Ownership History
Date
Name
Owned For
Owner Type
Purchase Details
Closed on
Apr 3, 2008
Sold by
American Inatl Solutio
Bought by
Bosworth Autumn and Stgeorge Susan
Current Estimated Value
Home Financials for this Owner
Home Financials are based on the most recent Mortgage that was taken out on this home.
Original Mortgage
$240,350
Interest Rate
6.06%
Mortgage Type
Purchase Money Mortgage
Purchase Details
Closed on
Jun 21, 2002
Sold by
Kobayashi Ky M and Kobayashi Michelle M
Bought by
Briley Dreama L
Purchase Details
Closed on
Jul 25, 2000
Sold by
Rondeau Gerard
Bought by
Webb Christopher
Purchase Details
Closed on
Jun 4, 1998
Sold by
Barber Jane M
Bought by
Kobayashi Ky M and Kobayashi Michelle M
Purchase Details
Closed on
Mar 11, 1987
Sold by
Kavanagh G C
Bought by
Barber Jane M
Create a Home Valuation Report for This Property
The Home Valuation Report is an in-depth analysis detailing your home's value as well as a comparison with similar homes in the area
Home Values in the Area
Average Home Value in this Area
Purchase History
| Date | Buyer | Sale Price | Title Company |
|---|---|---|---|
| Bosworth Autumn | $253,000 | -- | |
| American Inatl Soluton | $253,000 | -- | |
| Briley Dreama L | $218,000 | -- | |
| Webb Christopher | $14,500 | -- | |
| Kobayashi Ky M | $146,000 | -- | |
| Barber Jane M | $159,000 | -- |
Source: Public Records
Mortgage History
| Date | Status | Borrower | Loan Amount |
|---|---|---|---|
| Open | Barber Jane M | $226,700 | |
| Closed | Barber Jane M | $240,350 | |
| Previous Owner | Barber Jane M | $178,000 |
Source: Public Records
Tax History Compared to Growth
Tax History
| Year | Tax Paid | Tax Assessment Tax Assessment Total Assessment is a certain percentage of the fair market value that is determined by local assessors to be the total taxable value of land and additions on the property. | Land | Improvement |
|---|---|---|---|---|
| 2025 | $8,200 | $183,120 | $79,100 | $104,020 |
| 2024 | $7,755 | $183,120 | $79,100 | $104,020 |
| 2023 | $7,493 | $183,120 | $79,100 | $104,020 |
| 2022 | $7,449 | $183,120 | $79,100 | $104,020 |
| 2021 | $7,094 | $167,230 | $81,970 | $85,260 |
| 2020 | $6,718 | $160,720 | $76,720 | $84,000 |
| 2019 | $6,575 | $157,290 | $76,720 | $80,570 |
| 2018 | $6,449 | $157,290 | $76,720 | $80,570 |
| 2017 | $6,455 | $157,290 | $76,720 | $80,570 |
| 2016 | $6,275 | $158,830 | $65,380 | $93,450 |
| 2015 | $6,063 | $158,270 | $65,380 | $92,890 |
| 2014 | $5,915 | $158,270 | $65,380 | $92,890 |
Source: Public Records
Map
Nearby Homes
- 96 Bentwood Rd
- 422 S Main St
- 39 Cortland St
- 394 Trout Brook Dr
- 17 Parkview Rd
- 204 Trout Brook Dr
- 90 Park Place Cir Unit 90
- 49 Park Place Cir Unit 49
- 741 Quaker Ln S
- 18 Federal St
- 1145 New Britain Ave
- 39 Pheasant Hill Dr
- 49 Somerset St
- 61 Colonial St
- 479 S Main St
- 1 Valley Crest Dr
- 24 Thorne Rd Unit 24
- 107 Westgate St
- 34 Sandhurst Dr
- 148 Colonial St
- 32 Boswell Rd
- 18 Greenacres Ave
- 26 Boswell Rd
- 34 Boswell Rd
- 16 Greenacres Ave
- 17 Cottage Ave
- 17 Greenacres Ave
- 33 Boswell Rd
- 38 Boswell Rd
- 15 Cottage Ave
- 22 Boswell Rd
- 19 Cottage Ave
- 25 Boswell Rd
- 14 Greenacres Ave
- 15 Greenacres Ave
- 35 Boswell Rd
- 11 Cottage Ave
- 23 Boswell Rd
- 40 Boswell Rd
- 11 Greenacres Ave