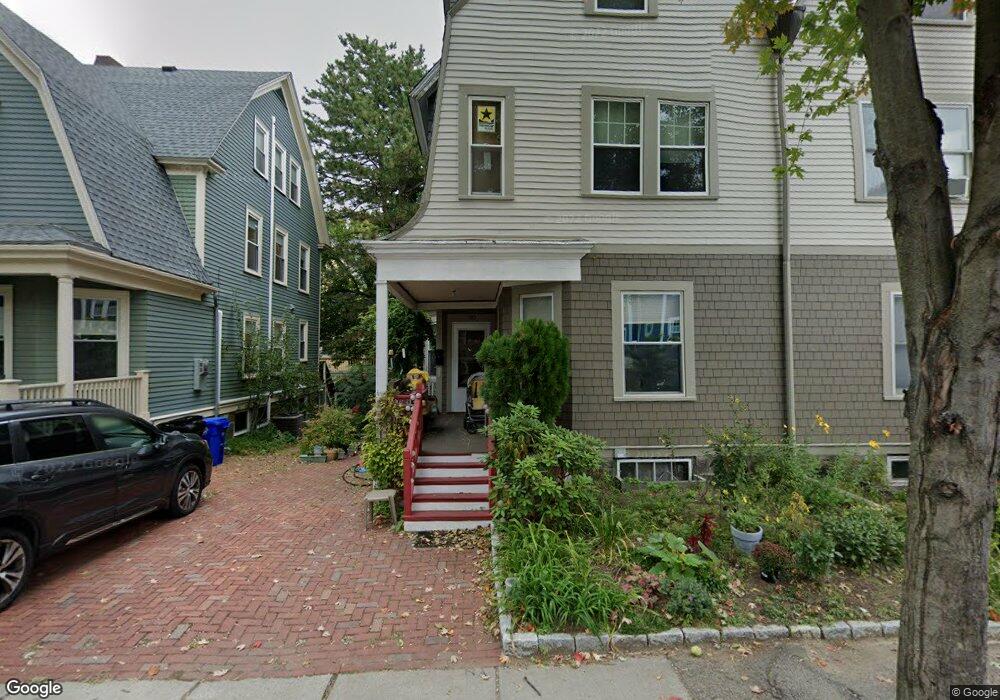
30 Bowker St Brookline, MA 02445
Brookline Village NeighborhoodEstimated Value: $1,640,000 - $2,118,000
5
Beds
2
Baths
2,105
Sq Ft
$872/Sq Ft
Est. Value
About This Home
This home is located at 30 Bowker St, Brookline, MA 02445 and is currently estimated at $1,835,477, approximately $871 per square foot. 30 Bowker St is a home located in Norfolk County with nearby schools including Amos A. Lawrence School, Brookline High School, and St. Mary of the Assumption Elementary School.
Ownership History
Date
Name
Owned For
Owner Type
Purchase Details
Closed on
May 11, 1990
Sold by
Daniell Jenny
Bought by
Murray Patricia
Current Estimated Value
Home Financials for this Owner
Home Financials are based on the most recent Mortgage that was taken out on this home.
Original Mortgage
$187,450
Interest Rate
10.15%
Mortgage Type
Purchase Money Mortgage
Purchase Details
Closed on
Sep 10, 1987
Sold by
Solomon Sandra S
Bought by
Patchen Jenny A
Create a Home Valuation Report for This Property
The Home Valuation Report is an in-depth analysis detailing your home's value as well as a comparison with similar homes in the area
Home Values in the Area
Average Home Value in this Area
Purchase History
| Date | Buyer | Sale Price | Title Company |
|---|---|---|---|
| Murray Patricia | $310,000 | -- | |
| Patchen Jenny A | $277,750 | -- |
Source: Public Records
Mortgage History
| Date | Status | Borrower | Loan Amount |
|---|---|---|---|
| Open | Patchen Jenny A | $194,000 | |
| Closed | Patchen Jenny A | $193,000 | |
| Closed | Patchen Jenny A | $187,000 | |
| Closed | Patchen Jenny A | $187,450 |
Source: Public Records
Tax History
| Year | Tax Paid | Tax Assessment Tax Assessment Total Assessment is a certain percentage of the fair market value that is determined by local assessors to be the total taxable value of land and additions on the property. | Land | Improvement |
|---|---|---|---|---|
| 2025 | $15,843 | $1,605,200 | $1,111,900 | $493,300 |
| 2024 | $15,056 | $1,541,000 | $1,069,000 | $472,000 |
| 2023 | $14,670 | $1,471,400 | $975,000 | $496,400 |
| 2022 | $14,278 | $1,401,200 | $928,500 | $472,700 |
| 2021 | $13,204 | $1,347,300 | $892,800 | $454,500 |
| 2020 | $11,897 | $1,258,900 | $811,700 | $447,200 |
| 2019 | $11,234 | $1,198,900 | $773,000 | $425,900 |
| 2018 | $10,042 | $1,061,500 | $643,700 | $417,800 |
| 2017 | $9,894 | $1,001,400 | $607,300 | $394,100 |
| 2016 | $9,756 | $936,300 | $567,800 | $368,500 |
| 2015 | $8,874 | $830,900 | $486,600 | $344,300 |
| 2014 | $8,769 | $769,900 | $442,300 | $327,600 |
Source: Public Records
Map
Nearby Homes
- 216 Aspinwall Ave
- 216 Aspinwall Ave Unit 3
- 58 Kent St Unit 301
- 58 Kent St Unit 305
- 58 Kent St Unit 402
- 58 Kent St Unit 404
- 96 Brook St Unit 3
- 6 Parkway Rd Unit 6
- 65 Francis St Unit A
- 390 Riverway Unit 24
- 6 Juniper St Unit 16
- 69 Walnut St Unit 2
- 69 Walnut St Unit 1
- 33 Pond Ave Unit 422
- 12 Thayer St
- 370 Washington St
- 77 Pond Ave Unit 1103
- 77 Pond Ave Unit 1506
- 77 Pond Ave Unit 401
- 820-824 Huntington Ave
Your Personal Tour Guide
Ask me questions while you tour the home.