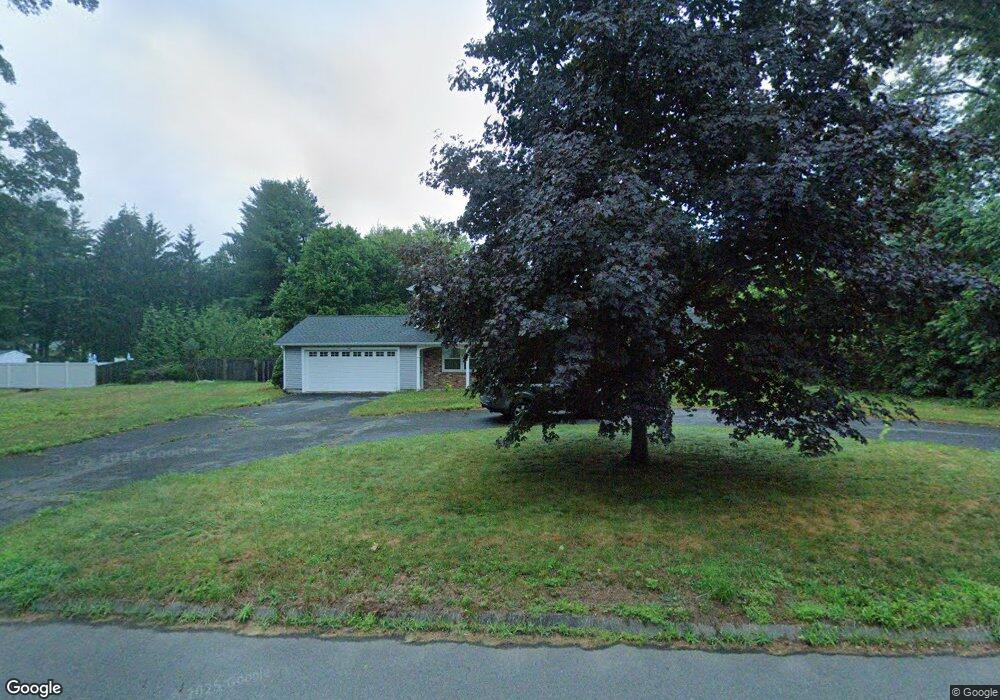
30 Bowling Green Dr North Haven, CT 06473
Estimated Value: $389,000 - $501,272
3
Beds
3
Baths
1,892
Sq Ft
$230/Sq Ft
Est. Value
About This Home
This home is located at 30 Bowling Green Dr, North Haven, CT 06473 and is currently estimated at $435,568, approximately $230 per square foot. 30 Bowling Green Dr is a home located in New Haven County with nearby schools including North Haven High School.
Ownership History
Date
Name
Owned For
Owner Type
Purchase Details
Closed on
Sep 15, 2025
Sold by
Sullivan Kathleen
Bought by
Brenner Jonathan M and Brenner Annette M
Current Estimated Value
Home Financials for this Owner
Home Financials are based on the most recent Mortgage that was taken out on this home.
Original Mortgage
$234,000
Outstanding Balance
$233,594
Interest Rate
6.72%
Mortgage Type
Future Advance Clause Open End Mortgage
Estimated Equity
$201,974
Purchase Details
Closed on
Mar 15, 2022
Sold by
Ferrara Nicholas
Bought by
Sullivan Kathleen
Home Financials for this Owner
Home Financials are based on the most recent Mortgage that was taken out on this home.
Original Mortgage
$150,000
Interest Rate
3.55%
Mortgage Type
New Conventional
Purchase Details
Closed on
Apr 29, 2008
Sold by
Sullivan Kenneth T and Sullivan Diane M
Bought by
Sullivan Kathleen A and Terrara Nicholas J
Home Financials for this Owner
Home Financials are based on the most recent Mortgage that was taken out on this home.
Original Mortgage
$200,000
Interest Rate
6.22%
Mortgage Type
Purchase Money Mortgage
Create a Home Valuation Report for This Property
The Home Valuation Report is an in-depth analysis detailing your home's value as well as a comparison with similar homes in the area
Home Values in the Area
Average Home Value in this Area
Purchase History
| Date | Buyer | Sale Price | Title Company |
|---|---|---|---|
| Brenner Jonathan M | $390,000 | -- | |
| Sullivan Kathleen | -- | None Available | |
| Sullivan Kathleen | -- | None Available | |
| Sullivan Kathleen A | $250,000 | -- | |
| Sullivan Kathleen A | $250,000 | -- |
Source: Public Records
Mortgage History
| Date | Status | Borrower | Loan Amount |
|---|---|---|---|
| Open | Brenner Jonathan M | $234,000 | |
| Previous Owner | Sullivan Kathleen | $150,000 | |
| Previous Owner | Sullivan Kathleen A | $187,500 | |
| Previous Owner | Sullivan Kathleen A | $200,000 |
Source: Public Records
Tax History Compared to Growth
Tax History
| Year | Tax Paid | Tax Assessment Tax Assessment Total Assessment is a certain percentage of the fair market value that is determined by local assessors to be the total taxable value of land and additions on the property. | Land | Improvement |
|---|---|---|---|---|
| 2025 | $9,152 | $310,660 | $76,300 | $234,360 |
| 2024 | $7,739 | $223,400 | $76,300 | $147,100 |
| 2023 | $7,294 | $223,400 | $76,300 | $147,100 |
| 2022 | $6,861 | $223,400 | $76,300 | $147,100 |
| 2021 | $6,861 | $223,400 | $76,300 | $147,100 |
| 2020 | $6,863 | $223,400 | $76,300 | $147,100 |
| 2019 | $6,777 | $217,350 | $83,440 | $133,910 |
| 2018 | $6,777 | $217,350 | $83,440 | $133,910 |
| 2017 | $6,647 | $217,350 | $83,440 | $133,910 |
| 2016 | $6,636 | $217,350 | $83,440 | $133,910 |
| 2015 | $6,394 | $217,350 | $83,440 | $133,910 |
| 2014 | $5,889 | $209,580 | $86,730 | $122,850 |
Source: Public Records
Map
Nearby Homes
- 14 Saint Andrews Cir Unit 6
- 7 Cypress Ln Unit 3
- 6 Cypress Ln Unit 2
- 100-150 Dodge Ave
- 3 Pilgrim Harbor Unit C
- 10 Pilgrim Harbor Unit D
- 3 Pilgrim Harbor Unit A
- 32 Brian Rd
- 26 Mallard Ct
- 12 Roxbury Ln
- 513 Pilgrim Harbor
- 11 Musket Dr
- 91 Pond Hill Rd
- 40 Woodland Ave
- 1450 Mount Carmel Ave
- 45 Pond Hill Lot 3 Rd
- 120 Grandview Ave
- 20 Fawn Ridge Dr
- 1350 Mount Carmel Ave
- 28 Fieldstone Ct Unit 28
- 80 Bradley St
- 80 Bradley St
- 80A Bradley St
- 20 Bowling Green Dr
- 36 Bowling Green Dr
- 31 Bowling Green Dr
- 82 Bradley St
- 35 Bowling Green Dr
- 27 Bowling Green Dr
- 18 Bowling Green Dr
- 76 Bradley St
- 84 Bradley St
- 86 Bradley St
- 23 Bowling Green Dr
- 72 Bradley St
- 19 Bowling Green Dr
- 15 Bowling Green Dr
- 39 Bowling Green Dr
- 14 Bowling Green Dr
- 2 Coventry Cir