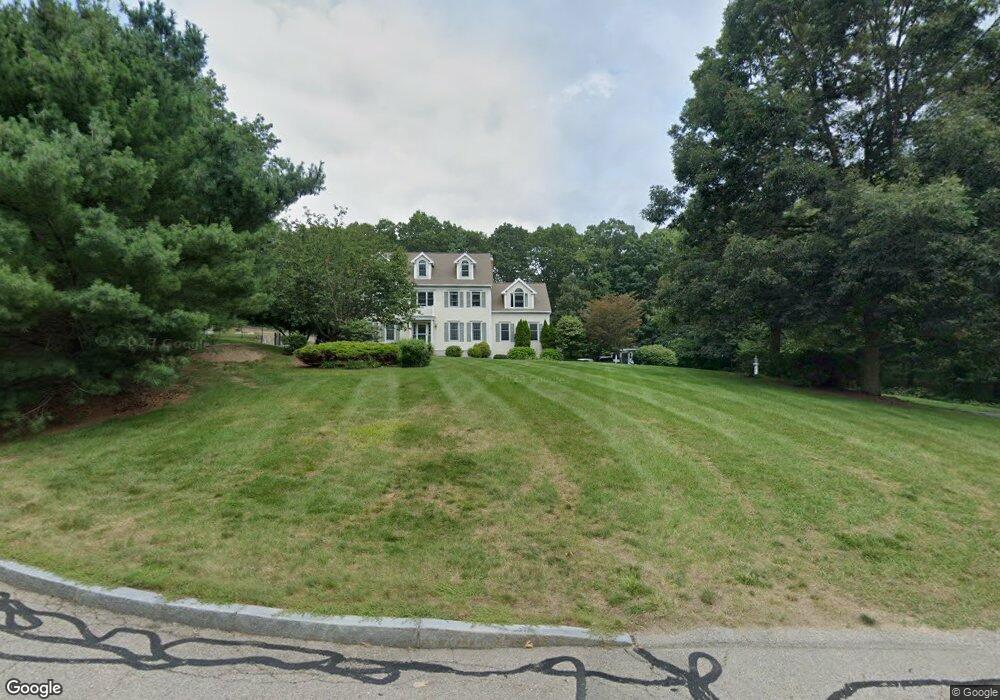
30 Boyden Rd Wrentham, MA 02093
West Wrentham NeighborhoodEstimated Value: $1,120,946 - $1,378,000
4
Beds
3
Baths
3,588
Sq Ft
$345/Sq Ft
Est. Value
About This Home
This home is located at 30 Boyden Rd, Wrentham, MA 02093 and is currently estimated at $1,236,737, approximately $344 per square foot. 30 Boyden Rd is a home located in Norfolk County with nearby schools including Delaney Elementary School, Charles E Roderick, and Mercymount Country Day School.
Ownership History
Date
Name
Owned For
Owner Type
Purchase Details
Closed on
Jan 19, 1996
Sold by
Wrentham Village Corp
Bought by
Hanson William J
Current Estimated Value
Home Financials for this Owner
Home Financials are based on the most recent Mortgage that was taken out on this home.
Original Mortgage
$260,000
Outstanding Balance
$6,928
Interest Rate
7.16%
Mortgage Type
Purchase Money Mortgage
Estimated Equity
$1,229,809
Create a Home Valuation Report for This Property
The Home Valuation Report is an in-depth analysis detailing your home's value as well as a comparison with similar homes in the area
Home Values in the Area
Average Home Value in this Area
Purchase History
| Date | Buyer | Sale Price | Title Company |
|---|---|---|---|
| Hanson William J | $105,000 | -- |
Source: Public Records
Mortgage History
| Date | Status | Borrower | Loan Amount |
|---|---|---|---|
| Open | Hanson William J | $260,000 |
Source: Public Records
Tax History
| Year | Tax Paid | Tax Assessment Tax Assessment Total Assessment is a certain percentage of the fair market value that is determined by local assessors to be the total taxable value of land and additions on the property. | Land | Improvement |
|---|---|---|---|---|
| 2025 | $11,767 | $1,015,300 | $331,700 | $683,600 |
| 2024 | $11,242 | $936,800 | $331,700 | $605,100 |
| 2023 | $11,140 | $882,700 | $301,700 | $581,000 |
| 2022 | $10,869 | $795,100 | $281,800 | $513,300 |
| 2021 | $9,938 | $706,300 | $246,000 | $460,300 |
| 2020 | $10,357 | $726,800 | $219,000 | $507,800 |
| 2019 | $9,962 | $705,500 | $219,000 | $486,500 |
| 2018 | $9,902 | $695,400 | $218,700 | $476,700 |
| 2017 | $9,599 | $673,600 | $214,400 | $459,200 |
| 2016 | $9,472 | $663,300 | $208,200 | $455,100 |
| 2015 | $9,563 | $638,400 | $200,200 | $438,200 |
| 2014 | $9,538 | $623,000 | $192,600 | $430,400 |
Source: Public Records
Map
Nearby Homes
- 10 Follett Dr
- 60 Grant Ave
- 1620 West St
- 1565 West St
- 2095 West St
- 9 Reagan Ave
- 172 Pine Swamp Rd
- 180 Pine Swamp Rd
- 56 Pine Swamp Rd
- 365 W Wrentham Rd
- 25 Nature View Dr
- 20 Nature View Dr
- 47 Austin Dr
- 900 Washington St Lot 2
- 925 Washington St
- 9 Pebble Cir Unit 9
- 65 Palmetto Dr Unit 65
- 21 Palmetto Dr Unit 21
- 24 Palmetto Dr Unit 24
- 11 Amber Dr
Your Personal Tour Guide
Ask me questions while you tour the home.