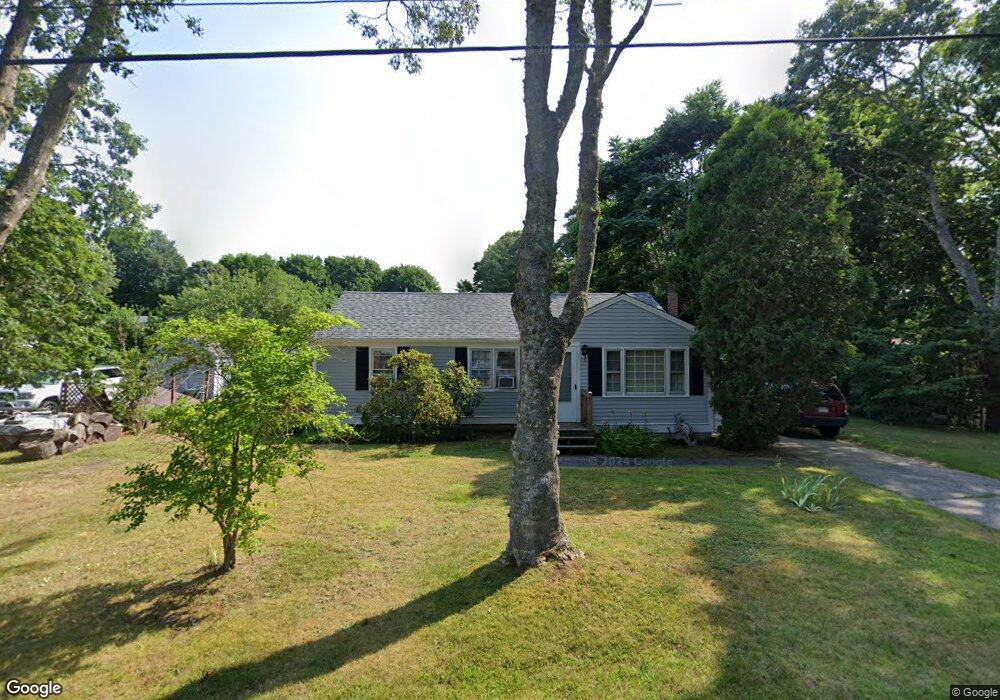
30 Brooks Rd Buzzards Bay, MA 02532
Monument Beach NeighborhoodEstimated Value: $501,144 - $559,000
3
Beds
1
Bath
1,001
Sq Ft
$525/Sq Ft
Est. Value
About This Home
This home is located at 30 Brooks Rd, Buzzards Bay, MA 02532 and is currently estimated at $525,036, approximately $524 per square foot. 30 Brooks Rd is a home located in Barnstable County with nearby schools including Bourne High School, St Margaret Regional School, and Cadence Academy Preschool - Bourne.
Ownership History
Date
Name
Owned For
Owner Type
Purchase Details
Closed on
Oct 15, 1999
Sold by
Scribner Barbara V
Bought by
Bulmer Roger W and Bulmer Trish D
Current Estimated Value
Home Financials for this Owner
Home Financials are based on the most recent Mortgage that was taken out on this home.
Original Mortgage
$133,896
Outstanding Balance
$38,928
Interest Rate
7.8%
Mortgage Type
Purchase Money Mortgage
Estimated Equity
$486,108
Create a Home Valuation Report for This Property
The Home Valuation Report is an in-depth analysis detailing your home's value as well as a comparison with similar homes in the area
Home Values in the Area
Average Home Value in this Area
Purchase History
| Date | Buyer | Sale Price | Title Company |
|---|---|---|---|
| Bulmer Roger W | $135,000 | -- | |
| Bulmer Roger W | $135,000 | -- |
Source: Public Records
Mortgage History
| Date | Status | Borrower | Loan Amount |
|---|---|---|---|
| Open | Bulmer Roger W | $133,896 | |
| Closed | Bulmer Roger W | $133,896 |
Source: Public Records
Tax History
| Year | Tax Paid | Tax Assessment Tax Assessment Total Assessment is a certain percentage of the fair market value that is determined by local assessors to be the total taxable value of land and additions on the property. | Land | Improvement |
|---|---|---|---|---|
| 2025 | $3,177 | $406,800 | $203,500 | $203,300 |
| 2024 | $3,100 | $386,500 | $193,800 | $192,700 |
| 2023 | $3,010 | $341,700 | $171,500 | $170,200 |
| 2022 | $2,898 | $287,200 | $151,800 | $135,400 |
| 2021 | $2,817 | $261,600 | $138,200 | $123,400 |
| 2020 | $2,725 | $253,700 | $136,800 | $116,900 |
| 2019 | $2,473 | $235,300 | $124,900 | $110,400 |
| 2018 | $2,310 | $219,200 | $119,000 | $100,200 |
| 2017 | $2,236 | $217,100 | $117,900 | $99,200 |
| 2016 | $2,007 | $197,500 | $117,900 | $79,600 |
| 2015 | $1,989 | $197,500 | $117,900 | $79,600 |
Source: Public Records
Map
Nearby Homes
- 203 County Rd
- 566 Shore Rd
- 13 Laurel Hill Ct
- 35 Benedict Rd
- 16 Amberwood Ct
- 12 Turnberry Rd Unit 12
- 5 Zoli Ln
- 5 Sea Knoll Ct
- 4 Harbor Hill Dr
- 4 Hollyhock Knoll Ct Unit 4
- 4 Hollyhock Knoll Ct Unit 4
- 20 Colony Ave
- 60 Bourne Neck Dr
- 44 Cotuit Rd
- 14 Navajo Rd
- 60 Sandwich Rd
- 10 Sandy Ln
- 46 Holt Rd Unit B
- 46 Holt Rd
- 709 County Rd
Your Personal Tour Guide
Ask me questions while you tour the home.