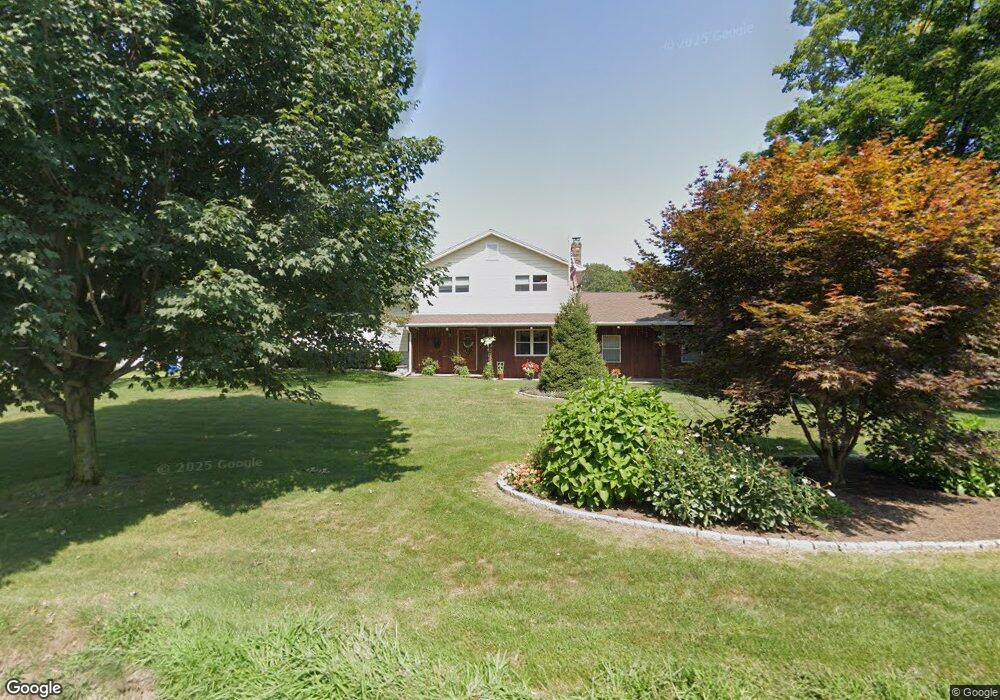
30 Burlington Rd Unionville, CT 06085
Estimated Value: $550,000 - $616,000
3
Beds
3
Baths
2,387
Sq Ft
$245/Sq Ft
Est. Value
About This Home
This home is located at 30 Burlington Rd, Unionville, CT 06085 and is currently estimated at $585,157, approximately $245 per square foot. 30 Burlington Rd is a home located in Hartford County with nearby schools including West Woods Upper Elementary School, Irving A. Robbins Middle School, and Farmington High School.
Ownership History
Date
Name
Owned For
Owner Type
Purchase Details
Closed on
Apr 25, 2006
Sold by
Belanger Vernon W and Belanger Kay F
Bought by
Szarejko Josef M and Szarejko Anna
Current Estimated Value
Home Financials for this Owner
Home Financials are based on the most recent Mortgage that was taken out on this home.
Original Mortgage
$296,000
Outstanding Balance
$170,199
Interest Rate
6.37%
Estimated Equity
$414,958
Purchase Details
Closed on
Dec 31, 2001
Sold by
Glynn Geraldine B
Bought by
Belanger Vernon and Belanger Kay F
Purchase Details
Closed on
Feb 28, 1996
Sold by
Belanger Tyson
Bought by
Thomas Philip and Sobuta Barbara
Home Financials for this Owner
Home Financials are based on the most recent Mortgage that was taken out on this home.
Original Mortgage
$124,200
Interest Rate
7.5%
Mortgage Type
Unknown
Create a Home Valuation Report for This Property
The Home Valuation Report is an in-depth analysis detailing your home's value as well as a comparison with similar homes in the area
Home Values in the Area
Average Home Value in this Area
Purchase History
| Date | Buyer | Sale Price | Title Company |
|---|---|---|---|
| Szarejko Josef M | $370,000 | -- | |
| Belanger Vernon | $110,000 | -- | |
| Thomas Philip | $128,400 | -- |
Source: Public Records
Mortgage History
| Date | Status | Borrower | Loan Amount |
|---|---|---|---|
| Open | Thomas Philip | $296,000 | |
| Previous Owner | Thomas Philip | $124,200 | |
| Previous Owner | Thomas Philip | $100,000 | |
| Previous Owner | Thomas Philip | $160,000 |
Source: Public Records
Tax History Compared to Growth
Tax History
| Year | Tax Paid | Tax Assessment Tax Assessment Total Assessment is a certain percentage of the fair market value that is determined by local assessors to be the total taxable value of land and additions on the property. | Land | Improvement |
|---|---|---|---|---|
| 2025 | $8,590 | $322,700 | $84,840 | $237,860 |
| 2024 | $8,213 | $322,700 | $84,840 | $237,860 |
| 2023 | $7,813 | $322,700 | $84,840 | $237,860 |
| 2022 | $6,583 | $224,510 | $77,120 | $147,390 |
| 2021 | $6,468 | $224,510 | $77,120 | $147,390 |
| 2020 | $6,280 | $224,510 | $77,120 | $147,390 |
| 2019 | $6,280 | $224,510 | $77,120 | $147,390 |
| 2018 | $6,102 | $224,510 | $77,120 | $147,390 |
| 2017 | $6,128 | $229,690 | $75,600 | $154,090 |
| 2016 | $5,921 | $229,690 | $75,600 | $154,090 |
| 2015 | $5,745 | $229,690 | $75,600 | $154,090 |
| 2014 | $5,614 | $229,690 | $75,600 | $154,090 |
Source: Public Records
Map
Nearby Homes
- 6 Burlington Rd
- 61 Litchfield Rd
- 69 Lake Garda Dr
- 487 Plainville Ave
- 50 E Shore Blvd
- 55 Depot Place
- 17 Pine Dr
- 27 Westview Terrace
- 7 Newcastle Place
- 31 Railroad Ave
- 10 Woodside Dr
- 16 Strong St
- 54 Westview Terrace
- 86 Alpine Dr
- 148 River Rd
- 243 New Britain Ave Unit 243
- 267 New Britain Ave
- 8919 Taine Mountain Rd
- 94 Perry St
- 1622 Farmington Ave Unit 4
- 34A Burlington Rd
- 34B Burlington Rd
- 29 Burlington Rd
- 58 Westmeath Ln
- 9458 W Meath Ln
- 34 Burlington Rd
- 41 Westmeath Ln
- 31 Burlington Rd
- 36 Burlington Rd
- 26 Burlington Rd
- 38 Burlington Rd
- 39 Westmeath Ln
- 63 Westmeath Ln
- 5A1 W Meath
- 5A2 W Meath Ln
- 35 Burlington Rd
- 1 Valerie Ln
- 21 Burlington Rd
- 39 Burlington Rd
- 42 Westmeath Ln