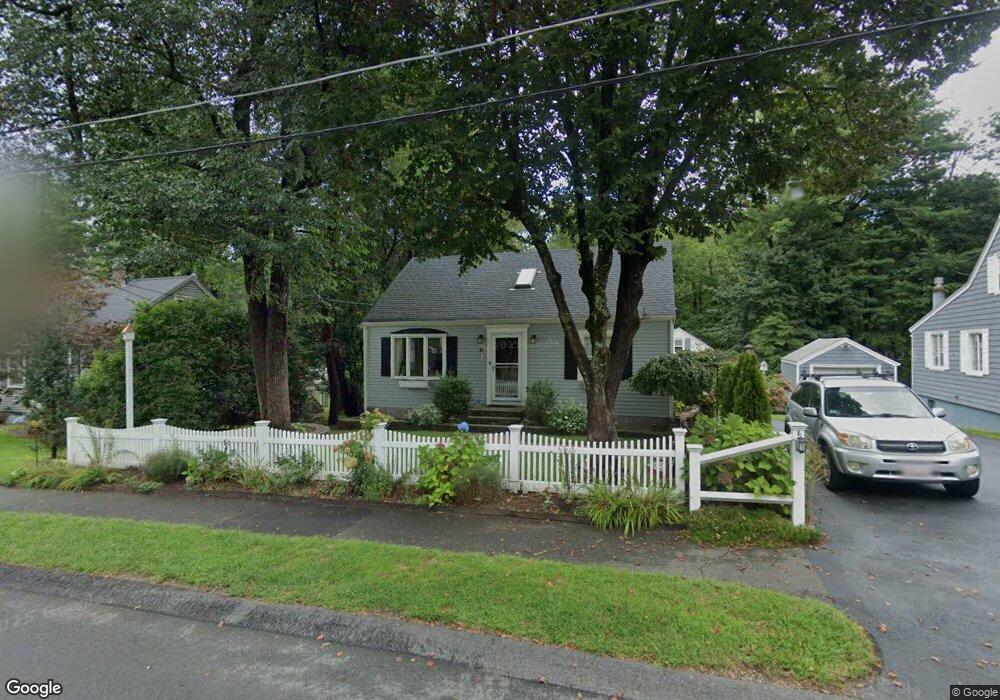
30 Calvert Rd East Walpole, MA 02032
Estimated Value: $696,049 - $2,391,000
4
Beds
3
Baths
1,648
Sq Ft
$682/Sq Ft
Est. Value
About This Home
This home is located at 30 Calvert Rd, East Walpole, MA 02032 and is currently estimated at $1,123,512, approximately $681 per square foot. 30 Calvert Rd is a home located in Norfolk County with nearby schools including Old Post Road School, Walpole Middle School, and Walpole High School.
Ownership History
Date
Name
Owned For
Owner Type
Purchase Details
Closed on
Jan 14, 2011
Sold by
Zinnack Michael
Bought by
Zinnack Michael and Gallo Linda D
Current Estimated Value
Home Financials for this Owner
Home Financials are based on the most recent Mortgage that was taken out on this home.
Original Mortgage
$223,000
Outstanding Balance
$149,689
Interest Rate
4.46%
Mortgage Type
Purchase Money Mortgage
Estimated Equity
$973,823
Create a Home Valuation Report for This Property
The Home Valuation Report is an in-depth analysis detailing your home's value as well as a comparison with similar homes in the area
Home Values in the Area
Average Home Value in this Area
Purchase History
| Date | Buyer | Sale Price | Title Company |
|---|---|---|---|
| Zinnack Michael | -- | -- |
Source: Public Records
Mortgage History
| Date | Status | Borrower | Loan Amount |
|---|---|---|---|
| Open | Zinnack Michael | $223,000 |
Source: Public Records
Tax History
| Year | Tax Paid | Tax Assessment Tax Assessment Total Assessment is a certain percentage of the fair market value that is determined by local assessors to be the total taxable value of land and additions on the property. | Land | Improvement |
|---|---|---|---|---|
| 2025 | $7,753 | $604,300 | $326,600 | $277,700 |
| 2024 | $7,541 | $570,400 | $314,000 | $256,400 |
| 2023 | $7,309 | $526,200 | $273,000 | $253,200 |
| 2022 | $6,877 | $475,600 | $252,800 | $222,800 |
| 2021 | $6,479 | $436,600 | $238,500 | $198,100 |
| 2020 | $6,411 | $427,700 | $225,000 | $202,700 |
| 2019 | $6,238 | $413,100 | $216,400 | $196,700 |
| 2018 | $5,822 | $381,300 | $207,900 | $173,400 |
| 2017 | $5,622 | $366,700 | $199,800 | $166,900 |
| 2016 | $5,323 | $342,100 | $192,100 | $150,000 |
| 2015 | $5,008 | $319,000 | $174,600 | $144,400 |
| 2014 | $4,835 | $306,800 | $174,600 | $132,200 |
Source: Public Records
Map
Nearby Homes
- 0 Charlotte Rd
- Unit 11 Powder House Ln Unit 11
- 8 Powder House Ln Unit 2
- Unit 12 Powder House Ln Unit 12
- Unit 3 Powder House Ln Unit 3
- 40 Endean Dr
- 7 Washington Green
- 120 Polley Ln
- 3 York Cir
- 363 - 367 Washington St
- 74 Alandale Pkwy
- 65 Alandale Pkwy
- 26 Saint Josephs Ave
- 53 Tremont St
- 70 Endicott St Unit 401
- 1086 Washington St
- 7 Cape Club Dr Unit 9
- 38 Cape Club Dr Unit 38
- 40 Cape Club Dr Unit 40
- 6 Orchard Dr
Your Personal Tour Guide
Ask me questions while you tour the home.