Estimated Value: $324,000 - $374,000
--
Bed
--
Bath
1,704
Sq Ft
$204/Sq Ft
Est. Value
About This Home
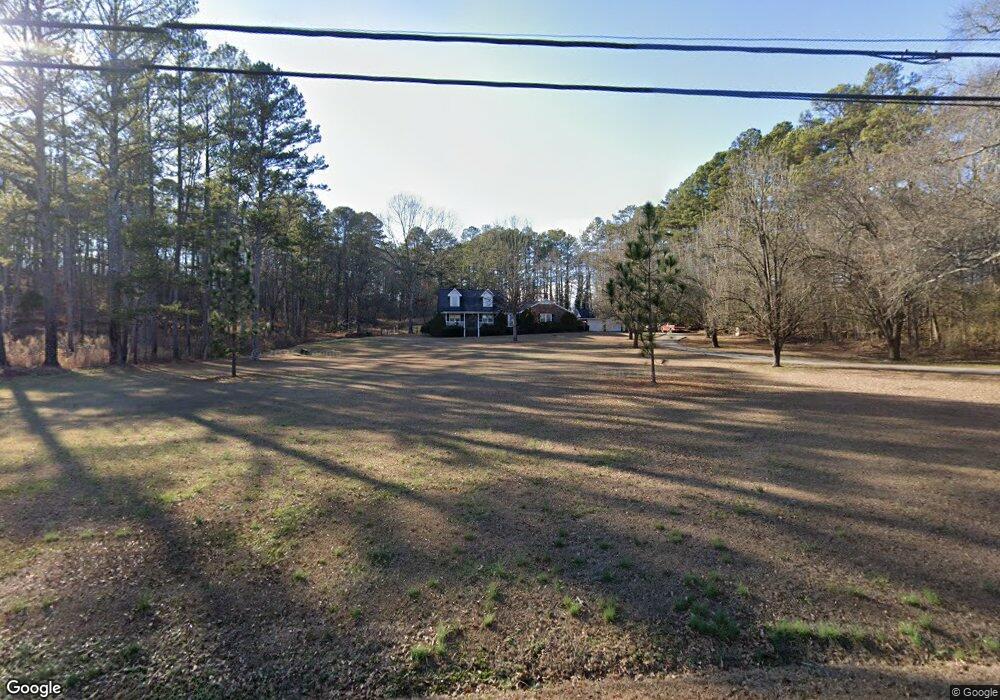
This home is located at 30 Canard Rd SE, Rome, GA 30161 and is currently estimated at $347,836, approximately $204 per square foot. 30 Canard Rd SE is a home located in Floyd County with nearby schools including Model Middle School, Model High School, and Unity Christian School.
Ownership History
Date
Name
Owned For
Owner Type
Purchase Details
Closed on
Jul 30, 1987
Sold by
Tyler Howard J and Tyler Carol E
Bought by
Tyler Rodney H and Tyler Clarice L
Current Estimated Value
Purchase Details
Closed on
Feb 7, 1979
Sold by
Fannin Harold
Bought by
Tyler Howard J and Tyler Carol E
Purchase Details
Closed on
Jan 31, 1978
Sold by
Whitener Billy Frankie
Bought by
Fannin Harold
Purchase Details
Closed on
Mar 20, 1975
Bought by
P and R
Purchase Details
Closed on
Dec 31, 1974
Sold by
Tyler Tony Lee
Bought by
Diversified Associates
Purchase Details
Closed on
Apr 8, 1969
Sold by
Simpson L F
Bought by
Tyler Tony Lee
Purchase Details
Closed on
Dec 27, 1968
Sold by
Reeves Sewell
Bought by
Simpson L F
Purchase Details
Closed on
Nov 16, 1965
Sold by
Yarbrough C F
Bought by
Reeves Sewell
Purchase Details
Closed on
Jan 1, 1959
Bought by
Yarbrough C F
Create a Home Valuation Report for This Property
The Home Valuation Report is an in-depth analysis detailing your home's value as well as a comparison with similar homes in the area
Home Values in the Area
Average Home Value in this Area
Purchase History
| Date | Buyer | Sale Price | Title Company |
|---|---|---|---|
| Tyler Rodney H | -- | -- | |
| Tyler Howard J | $5,000 | -- | |
| Fannin Harold | -- | -- | |
| P | -- | -- | |
| Whitener Billy Frankie | $4,000 | -- | |
| Diversified Associates | $7,500 | -- | |
| Tyler Tony Lee | $500 | -- | |
| Simpson L F | $1,100 | -- | |
| Reeves Sewell | -- | -- | |
| Yarbrough C F | -- | -- |
Source: Public Records
Tax History Compared to Growth
Tax History
| Year | Tax Paid | Tax Assessment Tax Assessment Total Assessment is a certain percentage of the fair market value that is determined by local assessors to be the total taxable value of land and additions on the property. | Land | Improvement |
|---|---|---|---|---|
| 2024 | $2,298 | $139,562 | $13,926 | $125,636 |
| 2023 | $2,976 | $119,646 | $12,660 | $106,986 |
| 2022 | $2,415 | $101,489 | $10,044 | $91,445 |
| 2021 | $2,059 | $81,057 | $9,136 | $71,921 |
| 2020 | $1,899 | $71,492 | $7,944 | $63,548 |
| 2019 | $1,840 | $69,375 | $7,944 | $61,431 |
| 2018 | $1,799 | $66,894 | $7,566 | $59,328 |
| 2017 | $1,742 | $63,552 | $7,005 | $56,547 |
| 2016 | $1,759 | $63,296 | $7,000 | $56,296 |
| 2015 | $1,725 | $63,296 | $7,000 | $56,296 |
| 2014 | $1,725 | $63,296 | $7,000 | $56,296 |
Source: Public Records
Map
Nearby Homes
- 21 Everwood Ct SE
- 30 Mountain Creek Dr SE
- 0 Fallen Branch Cir SE Unit 7397536
- 0 Fallen Branch Cir SE Unit 10311756
- 0 Fallen Branch Cir SE Unit 7234792
- 0 Fallen Branch Cir SE Unit 10172755
- 16 Fallen Branch Cir SE
- 1 Outpost Trail SE
- 3 Outpost Trail SE
- 0 Mountain Creek Dr SE Unit 10436191
- 0 N Quarters Dr Unit 7467468
- 0 N Quarters Dr Unit 37 10390869
- 406 Fred Kelly Rd NE
- 158 Sproull Rd SE
- 567 Fred Kelley Rd NE
- 45 Wildflower Rd NE
- 7 Trimble Way SE
- 139 Shoals Ferry Rd SE
- 818 Morrison Camp Ground Rd NE
- 127 Branson Rd SE
- 2836 Kingston Hwy SE
- 2836 Kingston Hwy SE
- 2861 Kingston Hwy NE
- 12 Canard Rd SE
- 2798 Kingston Hwy SE
- 35 Canard Rd SE
- 74 Canard Rd SE
- 15 Canard Rd SE
- 49 Canard Rd SE
- 2843 Kingston Hwy NE
- 2843 Kingston Hwy NE
- 2833 Kingston Hwy NE
- 86 Canard Rd SE
- 71 Canard Rd SE
- 2821 Kingston Hwy NE
- 2851 Kingston Hwy NE
- 2875 Kingston Hwy NE
- 2772 Kingston Hwy SE
- 2772 Kingston Hwy SE
- 1 Eastdell Rd NE