B
Seller's Agent in 2017
Brian Hansen
Fiv Realty Co.
(978) 621-5488
12 Total Sales


Estimated Value: $715,457 - $842,000
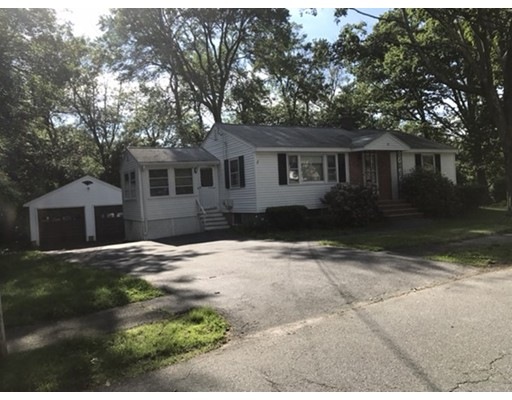
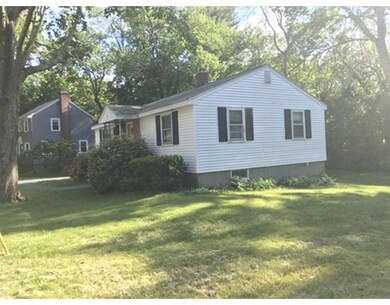
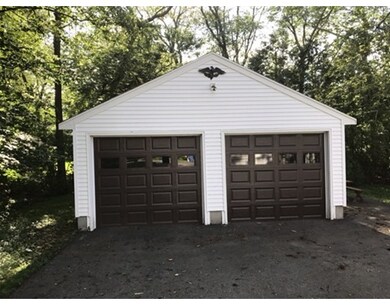
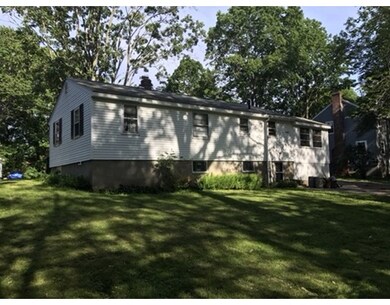
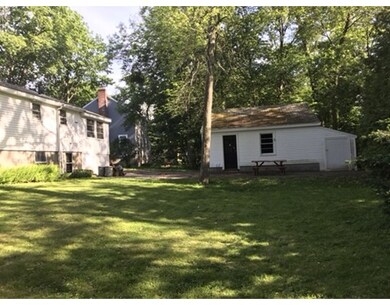
This commuter's dream home is perfect for a first time home buyer or someone looking to downsize. It is conveniently located within walking distance of the Reading commuter rail station and Reading Library, features easy access to Rtes. 93/95/128. This home is situated on a level lot with a detached two-car garage and plenty of storage. The living area features five spacious rooms, with hardwood flooring throughout, and a three-season porch that enters into the kitchen that flows directly into the living/dining area. The possibilities are endless with this home and it is a great chance to build equity.
Home Type
Single Family
Year Built
1957
Lot Details
0.26 Acres
| Date | Buyer | Sale Price | Title Company |
|---|---|---|---|
| Kelley Elizabeth | $460,000 | -- | |
| Carter Ft | -- | -- |
| Date | Status | Borrower | Loan Amount |
|---|---|---|---|
| Open | Kelley Elizabeth | $414,000 |
| Date | Event | Price | List to Sale | Price per Sq Ft |
|---|---|---|---|---|
| 08/15/2017 08/15/17 | Sold | $460,000 | +8.2% | $299 / Sq Ft |
| 06/21/2017 06/21/17 | Pending | -- | -- | -- |
| 06/12/2017 06/12/17 | For Sale | $425,000 | -- | $277 / Sq Ft |
| Year | Tax Paid | Tax Assessment Tax Assessment Total Assessment is a certain percentage of the fair market value that is determined by local assessors to be the total taxable value of land and additions on the property. | Land | Improvement |
|---|---|---|---|---|
| 2025 | $7,201 | $632,200 | $453,100 | $179,100 |
| 2024 | $7,285 | $621,600 | $445,400 | $176,200 |
| 2023 | $7,379 | $586,100 | $419,600 | $166,500 |
| 2022 | $7,158 | $537,000 | $383,900 | $153,100 |
| 2021 | $9,146 | $481,000 | $331,100 | $149,900 |
| 2020 | $7,376 | $465,700 | $320,400 | $145,300 |
| 2019 | $6,879 | $437,100 | $300,400 | $136,700 |
| 2018 | $8,428 | $425,300 | $286,000 | $139,300 |
| 2017 | $6,263 | $397,500 | $267,000 | $130,500 |
| 2016 | $5,717 | $394,300 | $268,000 | $126,300 |
| 2015 | $5,523 | $375,700 | $255,100 | $120,600 |
| 2014 | $5,159 | $350,000 | $237,300 | $112,700 |
B
Seller's Agent in 2017
Brian Hansen
Fiv Realty Co.
(978) 621-5488
12 Total Sales

Buyer's Agent in 2017
Bobbie Botticelli
Colonial Manor Realty
(781) 844-9371
43 in this area
70 Total Sales
Source: MLS Property Information Network (MLS PIN)
MLS Number: 72180876
APN: READ-000021-000000-000329
Disclaimer: Certain information contained herein is derived from information provided by parties other than Homes.com. All information provided is deemed reliable, but is not guaranteed to be accurate and should be independently verified.
![]() The property listing data and information, or the Images, set forth herein were provided to MLS Property Information Network, Inc. from third party sources, including sellers, lessors and public records, and were compiled by MLS Property Information Network, Inc. The property listing data and information, and the Images, are for the personal, non-commercial use of consumers having a good faith interest in purchasing or leasing listed properties of the type displayed to them and may not be used for any purpose other than to identify prospective properties which such consumers may have a good faith interest in purchasing or leasing. MLS Property Information Network, Inc. and its subscribers disclaim any and all representations and warranties as to the accuracy of the property listing data and information, or as to the accuracy of any of the Images, set forth herein.
The property listing data and information, or the Images, set forth herein were provided to MLS Property Information Network, Inc. from third party sources, including sellers, lessors and public records, and were compiled by MLS Property Information Network, Inc. The property listing data and information, and the Images, are for the personal, non-commercial use of consumers having a good faith interest in purchasing or leasing listed properties of the type displayed to them and may not be used for any purpose other than to identify prospective properties which such consumers may have a good faith interest in purchasing or leasing. MLS Property Information Network, Inc. and its subscribers disclaim any and all representations and warranties as to the accuracy of the property listing data and information, or as to the accuracy of any of the Images, set forth herein.
Ask me questions while you tour the home.