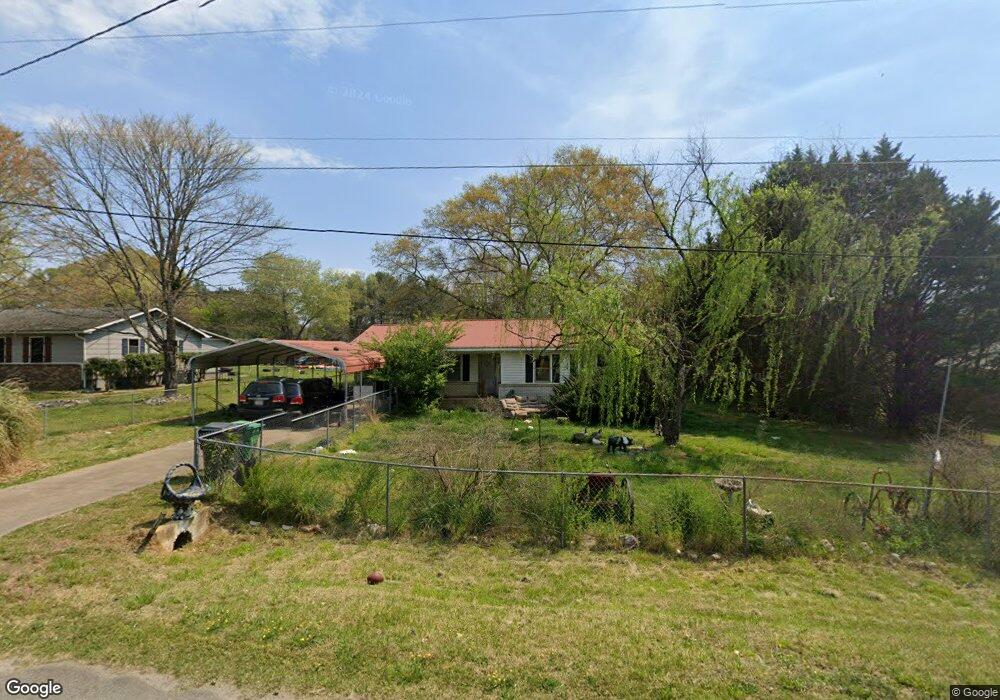
30 Cashtown Loop Rd Aragon, GA 30104
Estimated Value: $107,000 - $201,000
3
Beds
1
Bath
1,176
Sq Ft
$136/Sq Ft
Est. Value
About This Home
This home is located at 30 Cashtown Loop Rd, Aragon, GA 30104 and is currently estimated at $160,269, approximately $136 per square foot. 30 Cashtown Loop Rd is a home located in Polk County with nearby schools including Rockmart Middle School.
Ownership History
Date
Name
Owned For
Owner Type
Purchase Details
Closed on
Jun 4, 1982
Sold by
Farmers Home Admin
Bought by
Green Herman D
Current Estimated Value
Purchase Details
Closed on
Nov 16, 1981
Sold by
Neal Randall G
Bought by
Farmers Home Admin
Purchase Details
Closed on
Oct 18, 1976
Sold by
Green Herman D
Bought by
Farmers Home Admin
Purchase Details
Closed on
Jul 8, 1974
Sold by
Farmers Home Admin
Bought by
Green Herman D
Purchase Details
Closed on
Mar 14, 1974
Sold by
Childers Donald H
Bought by
Farmers Home Admin
Purchase Details
Closed on
Oct 28, 1972
Sold by
Forrister Alton F
Bought by
Childers Donald H
Purchase Details
Closed on
Feb 18, 1972
Sold by
Robinson Earl Dean
Bought by
Forrister Alton F
Purchase Details
Closed on
Jul 29, 1971
Sold by
Waters Noble
Bought by
Robinson Earl Dean
Purchase Details
Closed on
May 8, 1969
Bought by
Waters Noble
Purchase Details
Closed on
Jan 1, 1901
Sold by
Framers Home Admin
Bought by
Neal Randall G
Create a Home Valuation Report for This Property
The Home Valuation Report is an in-depth analysis detailing your home's value as well as a comparison with similar homes in the area
Home Values in the Area
Average Home Value in this Area
Purchase History
| Date | Buyer | Sale Price | Title Company |
|---|---|---|---|
| Green Herman D | -- | -- | |
| Farmers Home Admin | -- | -- | |
| Farmers Home Admin | -- | -- | |
| Green Herman D | -- | -- | |
| Farmers Home Admin | -- | -- | |
| Childers Donald H | -- | -- | |
| Forrister Alton F | -- | -- | |
| Robinson Earl Dean | -- | -- | |
| Waters Noble | -- | -- | |
| Neal Randall G | -- | -- |
Source: Public Records
Tax History Compared to Growth
Tax History
| Year | Tax Paid | Tax Assessment Tax Assessment Total Assessment is a certain percentage of the fair market value that is determined by local assessors to be the total taxable value of land and additions on the property. | Land | Improvement |
|---|---|---|---|---|
| 2024 | $789 | $37,762 | $8,000 | $29,762 |
| 2023 | $329 | $27,248 | $8,000 | $19,248 |
| 2022 | $267 | $24,630 | $8,000 | $16,630 |
| 2021 | $270 | $24,630 | $8,000 | $16,630 |
| 2020 | $271 | $24,630 | $8,000 | $16,630 |
| 2019 | $238 | $22,184 | $6,000 | $16,184 |
| 2018 | $231 | $21,714 | $6,000 | $15,714 |
| 2017 | $224 | $21,714 | $6,000 | $15,714 |
| 2016 | $224 | $21,714 | $6,000 | $15,714 |
| 2015 | $142 | $16,830 | $920 | $15,910 |
| 2014 | $143 | $16,830 | $920 | $15,910 |
Source: Public Records
Map
Nearby Homes
- 34 Hudson Loop Rd
- 330 Flint Hill Rd
- 156 Dogwood Glen Dr
- 180 Flint Hill Rd
- 65 Long Station Rd
- 133 N Bellview Rd
- 11 Magnolia St
- 15 Aragon Rd
- 0 Rome Hwy 101 Unit 25352772
- 0 Rome Hwy 101 Unit 10445422
- 18 Elm St
- 58 Elm St
- 1111 Old Collard Valley Rd
- 1 E 4th St
- 19 Walnut St
- 100 Hixville Rd
- 43 Creek Bank Rd
- 40 Cashtown Loop Rd
- 20 Cashtown Loop Rd
- 40 Cashtown Loop Rd
- 40 Cash Town Loop
- 12 Cashtown Loop Rd
- 41 Cash Town Loop
- 50 Cashtown Loop Rd
- 15 Cashtown Rd
- 53 Cashtown Loop Rd
- 53 Cashtown Loop Rd
- 41 Cashtown Loop Rd
- 41 Cashtown Loop Rd
- 53 Cash Town Loop
- 60 Cashtown Loop Rd
- 0 Cash Town Loop Unit 8254142
- 0 Cash Town Loop Unit 8026130
- 0 Cash Town Loop Unit 8026105
- 0 Cash Town Loop Unit 7599690
- 0 Cash Town Loop Unit 7599568
- 0 Cash Town Loop Unit 8304649