Estimated Value: $151,337 - $220,000
--
Bed
--
Bath
1,545
Sq Ft
$116/Sq Ft
Est. Value
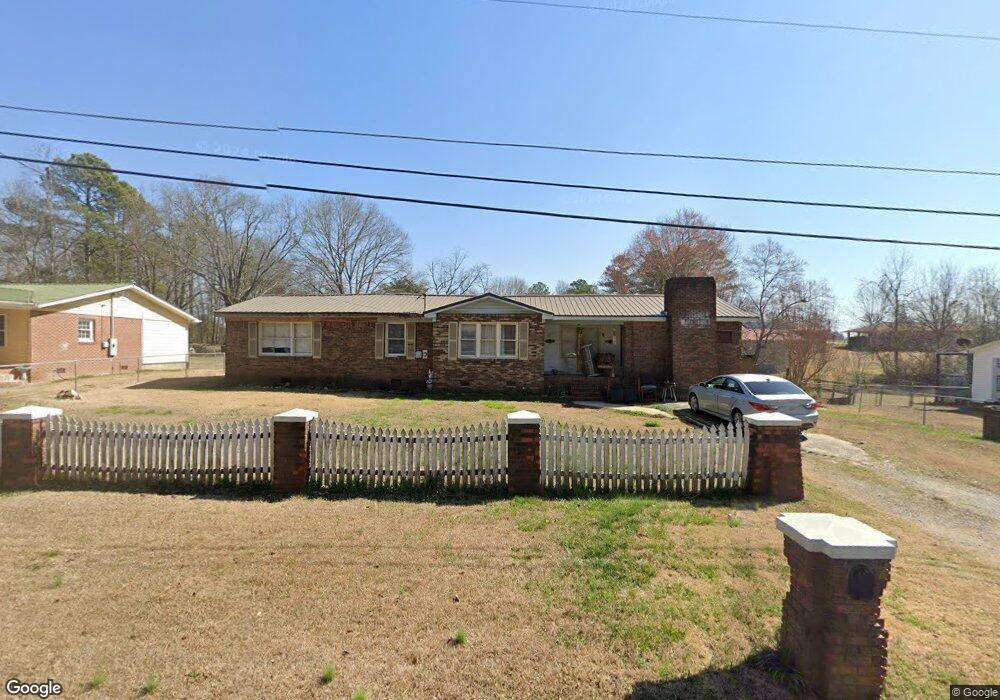
About This Home
This home is located at 30 Cedar Ln NW, Rome, GA 30165 and is currently estimated at $179,334, approximately $116 per square foot. 30 Cedar Ln NW is a home located in Floyd County with nearby schools including Coosa Middle School and Coosa High School.
Ownership History
Date
Name
Owned For
Owner Type
Purchase Details
Closed on
Mar 28, 2016
Sold by
Cristobal Evaristo
Bought by
Rodriguez Marcelino Lopez
Current Estimated Value
Purchase Details
Closed on
Nov 9, 2015
Sold by
Tumblin Charles W
Bought by
Cristobal Evaristo and Lopez Rebeca
Purchase Details
Closed on
May 17, 2013
Sold by
Ginn Mary Jane
Bought by
Ginn Rodger Corey
Purchase Details
Closed on
Jan 28, 2013
Sold by
Ginn Hiram Greer & Mary Jane
Bought by
Ginn Mary Jane
Purchase Details
Closed on
Nov 13, 2012
Sold by
Ginn Hiram Greer and Ginn Mary Jane
Bought by
Ginn Hiram Greer & Mary Jane
Purchase Details
Closed on
Nov 5, 2010
Sold by
Ginn Hiram
Bought by
Ginn Hiram Greer and Ginn Mary Jane
Purchase Details
Closed on
Aug 15, 1979
Sold by
Shell Home Bldrs
Bought by
Ginn Hiram
Purchase Details
Closed on
Aug 22, 1973
Sold by
Busey Dorothy R and Dean Covington
Bought by
Shell Home Bldrs
Purchase Details
Closed on
May 3, 1967
Bought by
Busey Dorothy R and Dean Covington
Create a Home Valuation Report for This Property
The Home Valuation Report is an in-depth analysis detailing your home's value as well as a comparison with similar homes in the area
Home Values in the Area
Average Home Value in this Area
Purchase History
| Date | Buyer | Sale Price | Title Company |
|---|---|---|---|
| Rodriguez Marcelino Lopez | -- | -- | |
| Cristobal Evaristo | $5,000 | -- | |
| Ginn Rodger Corey | -- | -- | |
| Ginn Mary Jane | -- | -- | |
| Ginn Hiram Greer & Mary Jane | -- | -- | |
| Ginn Hiram Greer | -- | -- | |
| Ginn Hiram | $23,000 | -- | |
| Shell Home Bldrs | $1,000 | -- | |
| Busey Dorothy R | -- | -- |
Source: Public Records
Tax History Compared to Growth
Tax History
| Year | Tax Paid | Tax Assessment Tax Assessment Total Assessment is a certain percentage of the fair market value that is determined by local assessors to be the total taxable value of land and additions on the property. | Land | Improvement |
|---|---|---|---|---|
| 2024 | $1,371 | $41,854 | $5,824 | $36,030 |
| 2023 | $1,260 | $39,402 | $4,992 | $34,410 |
| 2022 | $1,019 | $32,195 | $4,160 | $28,035 |
| 2021 | $933 | $28,857 | $4,160 | $24,697 |
| 2020 | $863 | $26,403 | $3,328 | $23,075 |
| 2019 | $801 | $24,826 | $3,328 | $21,498 |
| 2018 | $745 | $22,995 | $3,328 | $19,667 |
| 2017 | $718 | $22,045 | $3,328 | $18,717 |
| 2016 | $708 | $21,447 | $3,320 | $18,127 |
| 2015 | $695 | $21,447 | $3,320 | $18,127 |
| 2014 | $695 | $21,447 | $3,320 | $18,127 |
Source: Public Records
Map
Nearby Homes
- 33 Cedar Ln NW
- 31 Cedar Ln NW
- 43 Brownlow Dr NW
- 0 Alabama Hwy Unit 10590171
- 0 Alabama Hwy Unit 7635346
- 0 Alabama Hwy Unit 7494552
- 4813 Alabama Hwy SW
- 48 Atwood Dr NW
- 10 Nest Dr NW
- 36 Stargazer Trail NW
- 4485 Alabama Hwy
- 8 Kayla Dr NW
- 1 Ann Dr NW
- 5 Red Fox Dr SW
- 775 Mays Bridge Rd SW
- 26 Red Fox Dr SW
- 293 N Avery Rd NW
- 458 Kraftsman Rd SW
- 45 Albert Ave NW
- 86 N Avery Rd NW
- 30 Cedar Ln NW
- 28 Cedar Ln NW
- 34 Cedar Ln NW
- 31 Martin Rd NW
- 26 Cedar Ln NW
- 29 Martin Rd NW
- 27 Cedar Ln NW
- 36 Cedar Ln NW
- 27 Martin Rd NW
- 39 Martin Rd NW
- 3 Honeysuckle Ln NW
- 23 Cedar Ln NW
- 25 Martin Rd NW
- 32 Martin Rd NW
- 34 Martin Rd NW
- 28 Martin Rd NW
- 2 Honeysuckle Ln NW
- 2 Honeysuckle Ln NW
- 21 Cedar Ln NW
- 36 Martin Rd NW