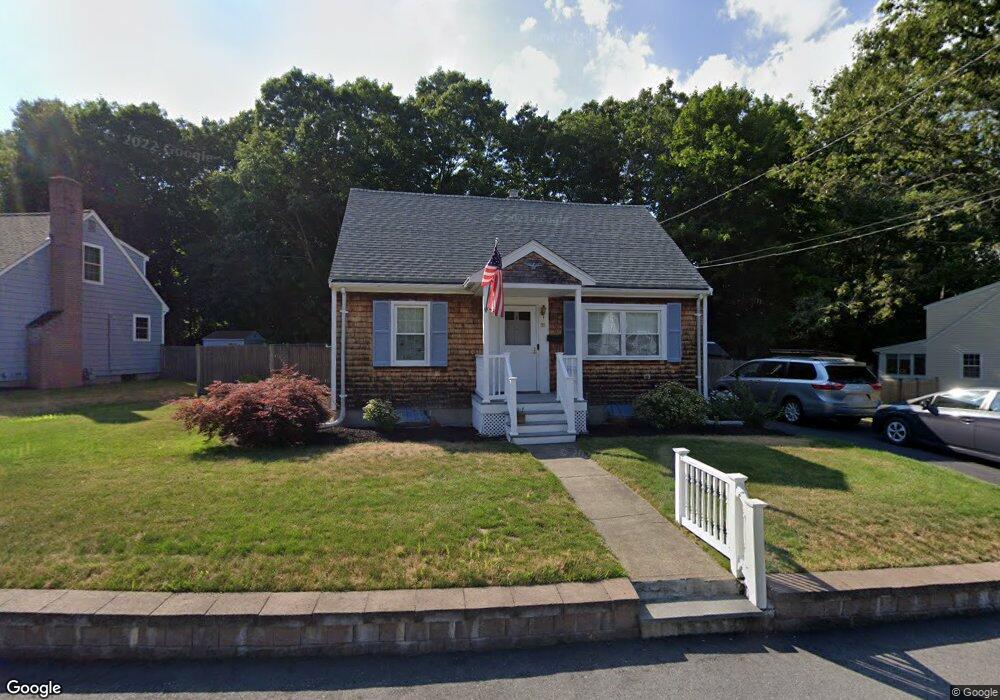
30 Centre St Natick, MA 01760
Estimated Value: $808,595 - $897,000
4
Beds
2
Baths
1,429
Sq Ft
$597/Sq Ft
Est. Value
About This Home
This home is located at 30 Centre St, Natick, MA 01760 and is currently estimated at $852,899, approximately $596 per square foot. 30 Centre St is a home located in Middlesex County with nearby schools including Natick High School, Wilson Middle School, and Bennett-Hemenway (Ben-Hem) Elementary School.
Ownership History
Date
Name
Owned For
Owner Type
Purchase Details
Closed on
May 29, 2015
Sold by
Condon Ft
Bought by
Nguyen Vin L and Zichittella Lauren
Current Estimated Value
Home Financials for this Owner
Home Financials are based on the most recent Mortgage that was taken out on this home.
Original Mortgage
$375,900
Outstanding Balance
$290,102
Interest Rate
3.65%
Mortgage Type
New Conventional
Estimated Equity
$562,797
Purchase Details
Closed on
Mar 30, 2004
Sold by
Condon Francis D and Condon Margaret I
Bought by
Condon Ft
Create a Home Valuation Report for This Property
The Home Valuation Report is an in-depth analysis detailing your home's value as well as a comparison with similar homes in the area
Home Values in the Area
Average Home Value in this Area
Purchase History
| Date | Buyer | Sale Price | Title Company |
|---|---|---|---|
| Nguyen Vin L | $469,999 | -- | |
| Condon Ft | -- | -- |
Source: Public Records
Mortgage History
| Date | Status | Borrower | Loan Amount |
|---|---|---|---|
| Open | Nguyen Vin L | $375,900 |
Source: Public Records
Tax History
| Year | Tax Paid | Tax Assessment Tax Assessment Total Assessment is a certain percentage of the fair market value that is determined by local assessors to be the total taxable value of land and additions on the property. | Land | Improvement |
|---|---|---|---|---|
| 2025 | $7,909 | $661,300 | $425,200 | $236,100 |
| 2024 | $7,612 | $620,900 | $400,200 | $220,700 |
| 2023 | $7,622 | $603,000 | $385,100 | $217,900 |
| 2022 | $7,217 | $541,000 | $335,100 | $205,900 |
| 2021 | $6,884 | $505,800 | $315,100 | $190,700 |
| 2020 | $6,680 | $490,800 | $300,100 | $190,700 |
| 2019 | $6,238 | $490,800 | $300,100 | $190,700 |
| 2018 | $5,970 | $457,500 | $300,100 | $157,400 |
| 2017 | $5,660 | $419,600 | $265,100 | $154,500 |
| 2016 | $5,328 | $392,600 | $250,100 | $142,500 |
| 2015 | -- | $380,900 | $250,100 | $130,800 |
Source: Public Records
Map
Nearby Homes
Your Personal Tour Guide
Ask me questions while you tour the home.