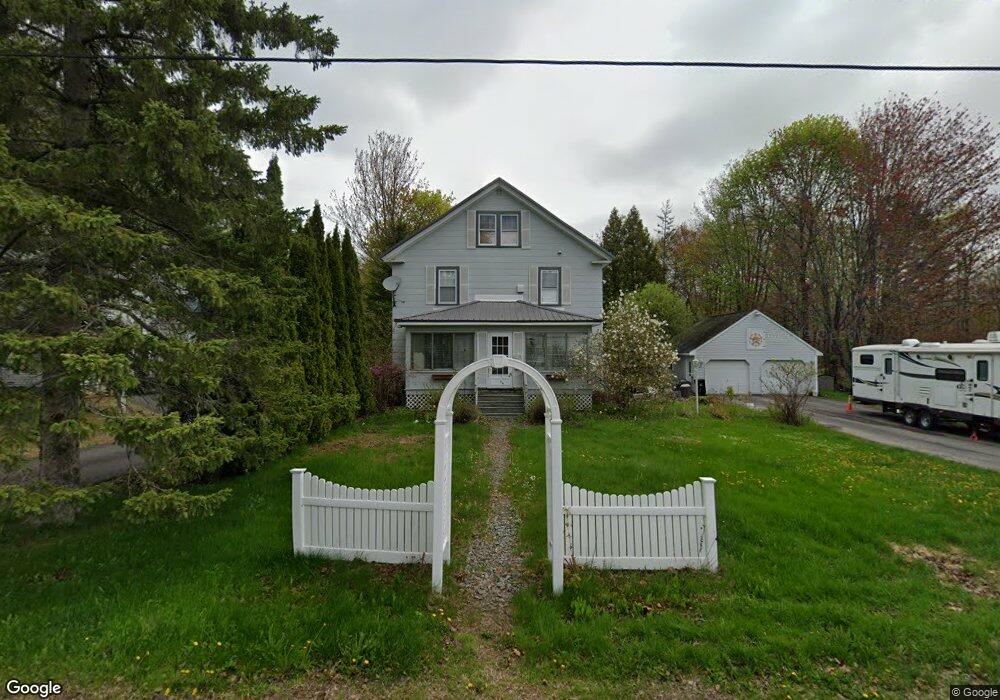
30 Chapman St Brewer, ME 04412
Estimated Value: $293,000 - $342,259
4
Beds
3
Baths
2,612
Sq Ft
$121/Sq Ft
Est. Value
About This Home
This home is located at 30 Chapman St, Brewer, ME 04412 and is currently estimated at $315,315, approximately $120 per square foot. 30 Chapman St is a home located in Penobscot County with nearby schools including Brewer Community School, Brewer High School, and All Saints Catholic School St. Mary's campus PreK-3.
Ownership History
Date
Name
Owned For
Owner Type
Purchase Details
Closed on
Sep 4, 2007
Sold by
Coutts C Stephen and Coutts Christine M
Bought by
Long Kevin M and Long Denise S
Current Estimated Value
Home Financials for this Owner
Home Financials are based on the most recent Mortgage that was taken out on this home.
Original Mortgage
$4,500,000
Outstanding Balance
$2,799,390
Interest Rate
6.59%
Mortgage Type
Unknown
Estimated Equity
-$2,484,075
Create a Home Valuation Report for This Property
The Home Valuation Report is an in-depth analysis detailing your home's value as well as a comparison with similar homes in the area
Home Values in the Area
Average Home Value in this Area
Purchase History
| Date | Buyer | Sale Price | Title Company |
|---|---|---|---|
| Long Kevin M | -- | -- |
Source: Public Records
Mortgage History
| Date | Status | Borrower | Loan Amount |
|---|---|---|---|
| Open | Long Kevin M | $174,000 | |
| Open | Long Kevin M | $4,500,000 | |
| Closed | Long Kevin M | $170,400 |
Source: Public Records
Tax History
| Year | Tax Paid | Tax Assessment Tax Assessment Total Assessment is a certain percentage of the fair market value that is determined by local assessors to be the total taxable value of land and additions on the property. | Land | Improvement |
|---|---|---|---|---|
| 2025 | $4,846 | $314,700 | $29,100 | $285,600 |
| 2024 | $4,856 | $258,300 | $29,100 | $229,200 |
| 2023 | $4,770 | $237,300 | $27,200 | $210,100 |
| 2021 | $4,391 | $196,900 | $26,700 | $170,200 |
| 2020 | $4,437 | $193,500 | $26,700 | $166,800 |
| 2019 | $4,449 | $193,500 | $26,700 | $166,800 |
| 2018 | $3,493 | $173,800 | $26,700 | $147,100 |
| 2017 | $3,985 | $173,800 | $26,700 | $147,100 |
| 2016 | $3,740 | $173,800 | $26,700 | $147,100 |
| 2015 | $3,525 | $173,800 | $26,700 | $147,100 |
| 2014 | $3,636 | $173,800 | $26,700 | $147,100 |
| 2013 | $3,822 | $182,700 | $19,000 | $163,700 |
Source: Public Records
Map
Nearby Homes
Your Personal Tour Guide
Ask me questions while you tour the home.