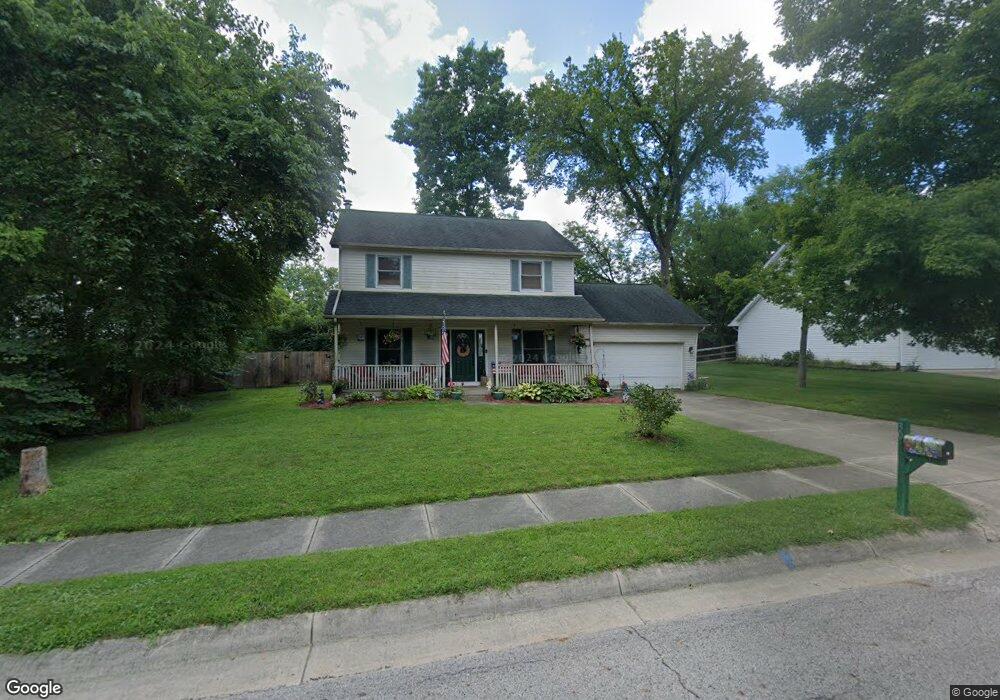
30 Christopher Dr Oxford, OH 45056
Estimated Value: $317,795 - $358,000
4
Beds
3
Baths
2,002
Sq Ft
$169/Sq Ft
Est. Value
About This Home
This home is located at 30 Christopher Dr, Oxford, OH 45056 and is currently estimated at $338,949, approximately $169 per square foot. 30 Christopher Dr is a home located in Butler County with nearby schools including Talawanda Middle School, Talawanda High School, and Mcguffey Montessori School.
Ownership History
Date
Name
Owned For
Owner Type
Purchase Details
Closed on
Apr 30, 2020
Sold by
Mcvey Stehen Michael and Mcvery Catherine M
Bought by
Crum Kelly J and Crum Racheal
Current Estimated Value
Purchase Details
Closed on
Oct 30, 2008
Sold by
Ramsey Steven D and Ramsey Judith L
Bought by
Ramsey Steven Dale
Purchase Details
Closed on
May 17, 2000
Sold by
Zampese Kenneth G and Zampese Christine M
Bought by
Mcvey Stephen Michael and Mcvey Catherine M
Home Financials for this Owner
Home Financials are based on the most recent Mortgage that was taken out on this home.
Original Mortgage
$155,800
Interest Rate
8.21%
Mortgage Type
Purchase Money Mortgage
Purchase Details
Closed on
May 28, 1996
Sold by
Jeffrey J Schroer Trst
Bought by
Et Al Kenneth G Zampese
Home Financials for this Owner
Home Financials are based on the most recent Mortgage that was taken out on this home.
Original Mortgage
$141,200
Interest Rate
8.1%
Mortgage Type
New Conventional
Purchase Details
Closed on
Aug 20, 1993
Create a Home Valuation Report for This Property
The Home Valuation Report is an in-depth analysis detailing your home's value as well as a comparison with similar homes in the area
Home Values in the Area
Average Home Value in this Area
Purchase History
| Date | Buyer | Sale Price | Title Company |
|---|---|---|---|
| Crum Kelly J | $215,000 | None Available | |
| Ramsey Steven Dale | -- | Attorney | |
| Mcvey Stephen Michael | $164,000 | -- | |
| Et Al Kenneth G Zampese | $156,900 | -- | |
| -- | $30,000 | -- |
Source: Public Records
Mortgage History
| Date | Status | Borrower | Loan Amount |
|---|---|---|---|
| Previous Owner | Mcvey Stephen Michael | $155,800 | |
| Previous Owner | Et Al Kenneth G Zampese | $141,200 |
Source: Public Records
Tax History
| Year | Tax Paid | Tax Assessment Tax Assessment Total Assessment is a certain percentage of the fair market value that is determined by local assessors to be the total taxable value of land and additions on the property. | Land | Improvement |
|---|---|---|---|---|
| 2025 | $2,999 | $81,350 | $16,760 | $64,590 |
| 2024 | $2,999 | $81,350 | $16,760 | $64,590 |
| 2023 | $2,682 | $81,350 | $16,760 | $64,590 |
| 2022 | $2,682 | $69,390 | $16,760 | $52,630 |
| 2021 | $2,566 | $69,390 | $16,760 | $52,630 |
| 2020 | $2,683 | $69,390 | $16,760 | $52,630 |
| 2019 | $4,117 | $54,500 | $16,180 | $38,320 |
| 2018 | $2,222 | $54,500 | $16,180 | $38,320 |
| 2017 | $1,997 | $54,500 | $16,180 | $38,320 |
| 2016 | $2,064 | $54,500 | $16,180 | $38,320 |
| 2015 | $2,100 | $54,500 | $16,180 | $38,320 |
| 2014 | $3,586 | $54,500 | $16,180 | $38,320 |
| 2013 | $3,586 | $61,040 | $16,180 | $44,860 |
Source: Public Records
Map
Nearby Homes
- 507 N Beech St
- 136 N Ridge Dr
- 138 N Ridge Dr
- 16 W Sycamore St
- 5130 Brown Rd
- 317 N Beech St
- 18 E Vine St
- 108 W Vine St
- 626 Honor Ln
- 849 Dufour Ln
- 5706 Forest Ridge Dr
- 5372 Hester Rd
- 5700 Forest Ridge Dr
- 5805 Hester Rd
- 6200 Hester Rd
- 117 Marti Ct
- 230 W Collins St
- 217 S Main St
- 5285 College Corner Pike
- 5115 Bonham Rd
- 38 Christopher Dr
- 28 Christopher Dr
- 1 Jeffrey Dr
- 36 Kelly Dr
- 36 Kelly Dr Unit 38
- 38 Kelly Dr
- 46 Kelly Dr
- 8 Christopher Dr
- 42 Christopher Dr
- 33 Christopher Dr
- 56 Kelly Dr
- 25 Christopher Dr
- 48 Kelly Dr
- 41 Christopher Dr
- 58 Kelly Dr
- 45 Kelly Dr
- 47 Kelly Dr
- 54 Christopher Dr
- 21 Christopher Dr
- 66 Kelly Dr
Your Personal Tour Guide
Ask me questions while you tour the home.