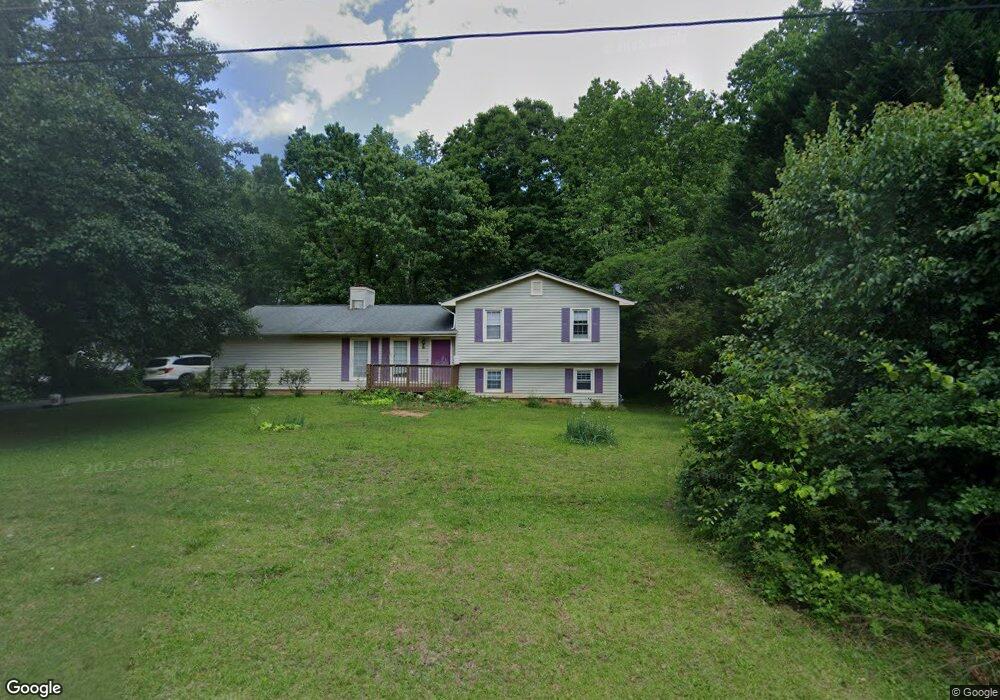
30 Clingstone Cir Unit 132 Newnan, GA 30265
Estimated Value: $292,000 - $378,000
4
Beds
2
Baths
2,148
Sq Ft
$151/Sq Ft
Est. Value
About This Home
This home is located at 30 Clingstone Cir Unit 132, Newnan, GA 30265 and is currently estimated at $325,340, approximately $151 per square foot. 30 Clingstone Cir Unit 132 is a home located in Coweta County with nearby schools including Willis Road Elementary School, Lee Middle School, and East Coweta High School.
Ownership History
Date
Name
Owned For
Owner Type
Purchase Details
Closed on
Nov 16, 2017
Sold by
Bmy Investment Llc
Bought by
Huilin Zhang and Zhang Dong
Current Estimated Value
Home Financials for this Owner
Home Financials are based on the most recent Mortgage that was taken out on this home.
Original Mortgage
$108,000
Outstanding Balance
$90,355
Interest Rate
3.88%
Mortgage Type
New Conventional
Estimated Equity
$234,985
Purchase Details
Closed on
Jan 15, 2016
Sold by
Shuai Ni Zhou
Bought by
Bmy Investment Llc
Purchase Details
Closed on
Mar 26, 2010
Sold by
Federal Natl Mtg Assn Fnma
Bought by
Ni Zhou S
Purchase Details
Closed on
Oct 6, 2009
Sold by
National Cty R/E Svcs Llc
Bought by
Federal Natl Mtg Assn Fnma
Purchase Details
Closed on
Aug 29, 1989
Bought by
Campbell Roy W and Campbell Mar
Create a Home Valuation Report for This Property
The Home Valuation Report is an in-depth analysis detailing your home's value as well as a comparison with similar homes in the area
Home Values in the Area
Average Home Value in this Area
Purchase History
| Date | Buyer | Sale Price | Title Company |
|---|---|---|---|
| Huilin Zhang | $135,000 | -- | |
| Bmy Investment Llc | -- | -- | |
| Ni Zhou S | -- | -- | |
| Federal Natl Mtg Assn Fnma | -- | -- | |
| National Cty R/E Svcs Llc | $62,156 | -- | |
| Federal National Mortgage Assn | $62,200 | -- | |
| Campbell Roy W | $72,900 | -- |
Source: Public Records
Mortgage History
| Date | Status | Borrower | Loan Amount |
|---|---|---|---|
| Open | Huilin Zhang | $108,000 |
Source: Public Records
Tax History Compared to Growth
Tax History
| Year | Tax Paid | Tax Assessment Tax Assessment Total Assessment is a certain percentage of the fair market value that is determined by local assessors to be the total taxable value of land and additions on the property. | Land | Improvement |
|---|---|---|---|---|
| 2025 | $3,058 | $129,448 | $20,000 | $109,448 |
| 2024 | $2,538 | $109,309 | $20,000 | $89,309 |
| 2023 | $2,538 | $110,271 | $16,000 | $94,271 |
| 2022 | $2,159 | $87,643 | $16,000 | $71,643 |
| 2021 | $1,653 | $62,800 | $8,000 | $54,800 |
| 2020 | $1,664 | $62,800 | $8,000 | $54,800 |
| 2019 | $1,598 | $54,588 | $8,000 | $46,588 |
| 2018 | $1,583 | $54,588 | $8,000 | $46,588 |
| 2017 | $1,134 | $38,685 | $8,000 | $30,685 |
| 2016 | $1,118 | $45,410 | $8,000 | $37,410 |
| 2015 | $989 | $34,722 | $8,000 | $26,722 |
| 2014 | $626 | $22,170 | $4,000 | $18,170 |
Source: Public Records
Map
Nearby Homes
- 140 Elberta Dr
- 35 Candlewood Dr
- 2462 Sharpsburg McCullum Rd
- 110 Crawford Cir
- 30 Creekwood Dr
- 65 Ellis Rd
- 285 Nectarine Dr
- 410 Freestone Dr
- 165 Bartlett Dr
- 283 Sawgrass Manor Dr
- 147 Crossroads Est Dr
- 160 Maple Leaf Rd
- 108 Waterford Place
- 3771 Highway 34 E Unit TRACT2
- 3771 Highway 34 E Unit TRACT1
- 14 Emory St
- Spring Forest Way Lot: 2-1
- 7 Buck Trail
- 150 Park Timbers Dr
- 185 Grand Jct
- 30 Clingstone Cir
- 40 Clingstone Cir
- 20 Clingstone Cir
- 50 Clingstone Cir
- 25 Clingstone Cir
- 35 Clingstone Cir
- 15 Clingstone Cir
- 20 Freestone Dr
- 60 Clingstone Cir
- 30 Freestone Dr
- 10 Freestone Dr
- 55 Clingstone Cir
- 2211 Sharpsburg McCollum Rd
- 2223 Highway 154
- 2223 Sharpsburg McCullum Rd Unit 1
- 2223 Highway 154
- 2197 Sharpsburg McCullum Rd
- 62 Carmen Ct
- 40 Freestone Dr
- 20 Carmen Ct