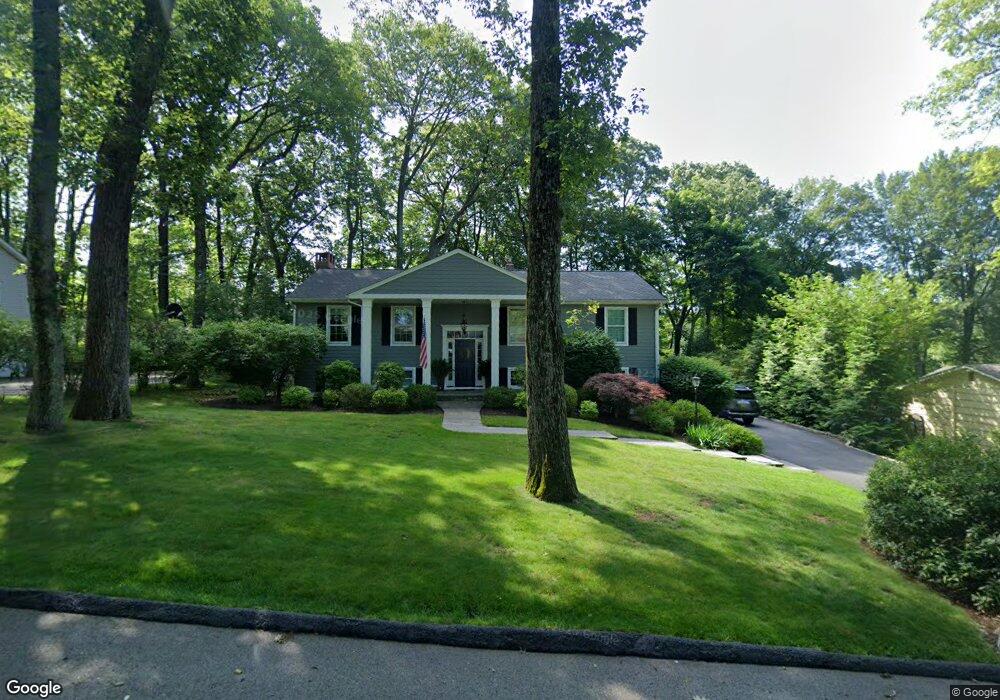
30 Clover Ln Randolph, NJ 07869
Estimated Value: $750,000 - $825,066
--
Bed
--
Bath
2,154
Sq Ft
$364/Sq Ft
Est. Value
About This Home
This home is located at 30 Clover Ln, Randolph, NJ 07869 and is currently estimated at $784,517, approximately $364 per square foot. 30 Clover Ln is a home located in Morris County with nearby schools including Randolph High School, Randolph Middle School, and Cheder Lubavitch.
Ownership History
Date
Name
Owned For
Owner Type
Purchase Details
Closed on
Jan 15, 2001
Sold by
Freeman Austin S and Freeman Dara J
Bought by
Insinga John F and Insinga Melissa M
Current Estimated Value
Home Financials for this Owner
Home Financials are based on the most recent Mortgage that was taken out on this home.
Original Mortgage
$264,000
Outstanding Balance
$97,265
Interest Rate
7.52%
Estimated Equity
$687,252
Purchase Details
Closed on
Jun 27, 1999
Sold by
Shafrir Kobi and Shafrir Lori
Bought by
Freeman Austin S and Freeman Dara J
Home Financials for this Owner
Home Financials are based on the most recent Mortgage that was taken out on this home.
Original Mortgage
$220,000
Interest Rate
7.19%
Purchase Details
Closed on
Apr 21, 1997
Sold by
Rispoli Richard M and Rispoli Susan D
Bought by
Shafrir Kobi and Shafrir Lori
Home Financials for this Owner
Home Financials are based on the most recent Mortgage that was taken out on this home.
Original Mortgage
$125,000
Interest Rate
7.77%
Create a Home Valuation Report for This Property
The Home Valuation Report is an in-depth analysis detailing your home's value as well as a comparison with similar homes in the area
Home Values in the Area
Average Home Value in this Area
Purchase History
| Date | Buyer | Sale Price | Title Company |
|---|---|---|---|
| Insinga John F | $330,000 | -- | |
| Freeman Austin S | $275,000 | -- | |
| Shafrir Kobi | $249,000 | -- |
Source: Public Records
Mortgage History
| Date | Status | Borrower | Loan Amount |
|---|---|---|---|
| Open | Insinga John F | $264,000 | |
| Previous Owner | Freeman Austin S | $220,000 | |
| Previous Owner | Shafrir Kobi | $125,000 |
Source: Public Records
Tax History Compared to Growth
Tax History
| Year | Tax Paid | Tax Assessment Tax Assessment Total Assessment is a certain percentage of the fair market value that is determined by local assessors to be the total taxable value of land and additions on the property. | Land | Improvement |
|---|---|---|---|---|
| 2025 | $12,287 | $434,000 | $182,600 | $251,400 |
| 2024 | $11,978 | $434,000 | $182,600 | $251,400 |
| 2023 | $11,978 | $434,000 | $182,600 | $251,400 |
| 2022 | $11,510 | $434,000 | $182,600 | $251,400 |
| 2021 | $11,510 | $434,000 | $182,600 | $251,400 |
| 2020 | $11,393 | $434,000 | $182,600 | $251,400 |
| 2019 | $11,262 | $434,000 | $182,600 | $251,400 |
| 2018 | $10,704 | $417,800 | $182,600 | $235,200 |
| 2017 | $10,570 | $417,800 | $182,600 | $235,200 |
| 2016 | $9,791 | $267,500 | $126,500 | $141,000 |
| 2015 | $9,673 | $267,500 | $126,500 | $141,000 |
| 2014 | $9,523 | $267,500 | $126,500 | $141,000 |
Source: Public Records
Map
Nearby Homes