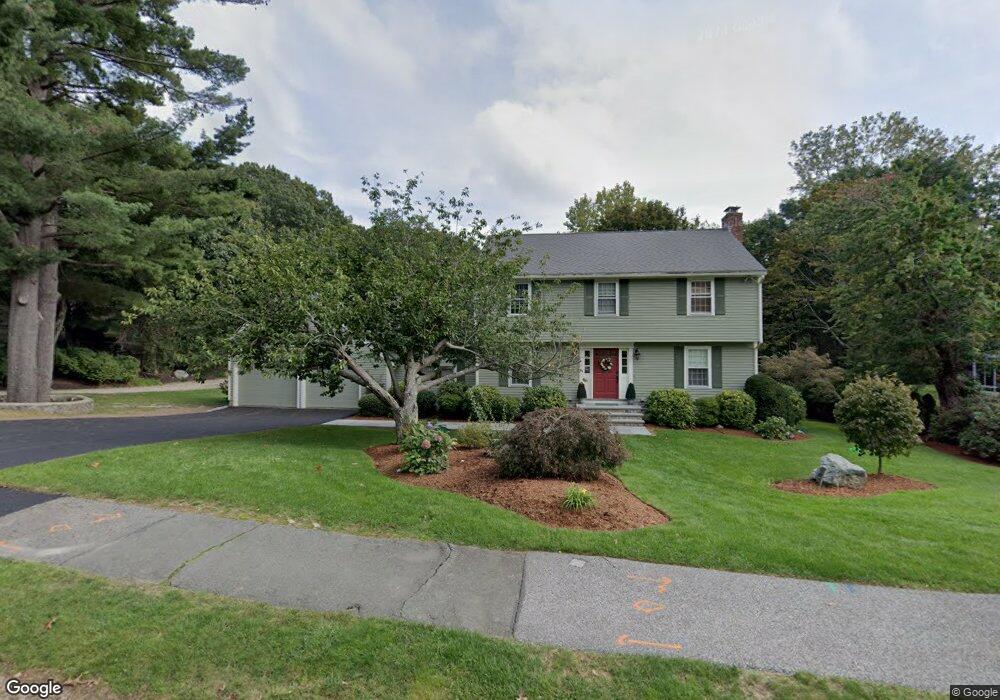
30 Coolidge Rd Winchester, MA 01890
West Side NeighborhoodEstimated Value: $1,623,000 - $1,704,925
4
Beds
4
Baths
2,329
Sq Ft
$718/Sq Ft
Est. Value
About This Home
This home is located at 30 Coolidge Rd, Winchester, MA 01890 and is currently estimated at $1,671,981, approximately $717 per square foot. 30 Coolidge Rd is a home located in Middlesex County with nearby schools including Vinson-Owen Elementary School, McCall Middle School, and Winchester High School.
Ownership History
Date
Name
Owned For
Owner Type
Purchase Details
Closed on
Jun 30, 1995
Sold by
Coolidge Rt and Greco Donna
Bought by
Grelotti Richard G and Grelotti Donal M
Current Estimated Value
Home Financials for this Owner
Home Financials are based on the most recent Mortgage that was taken out on this home.
Original Mortgage
$170,000
Interest Rate
7.8%
Mortgage Type
Purchase Money Mortgage
Create a Home Valuation Report for This Property
The Home Valuation Report is an in-depth analysis detailing your home's value as well as a comparison with similar homes in the area
Home Values in the Area
Average Home Value in this Area
Purchase History
We collect this data history from publicly available records. To have your information removed, we recommend requesting removal directly through your county’s website.
| Date | Buyer | Sale Price | Title Company |
|---|---|---|---|
| Grelotti Richard G | $378,000 | -- |
Source: Public Records
Mortgage History
We collect this data history from publicly available records. To have your information removed, we recommend requesting removal directly through your county’s website.
| Date | Status | Borrower | Loan Amount |
|---|---|---|---|
| Open | Grelotti Richard G | $204,000 | |
| Closed | Grelotti Richard G | $170,000 |
Source: Public Records
Tax History
| Year | Tax Paid | Tax Assessment Tax Assessment Total Assessment is a certain percentage of the fair market value that is determined by local assessors to be the total taxable value of land and additions on the property. | Land | Improvement |
|---|---|---|---|---|
| 2025 | $181 | $1,629,700 | $1,001,300 | $628,400 |
| 2024 | $17,056 | $1,505,400 | $921,300 | $584,100 |
| 2023 | $15,682 | $1,329,000 | $761,300 | $567,700 |
| 2022 | $15,705 | $1,255,400 | $701,200 | $554,200 |
| 2021 | $5,235 | $1,155,400 | $601,200 | $554,200 |
| 2020 | $14,315 | $1,155,400 | $601,200 | $554,200 |
| 2019 | $4,955 | $1,115,400 | $561,200 | $554,200 |
| 2018 | $4,755 | $1,056,400 | $516,200 | $540,200 |
| 2017 | $12,726 | $1,036,300 | $516,200 | $520,100 |
| 2016 | $11,938 | $1,022,100 | $516,200 | $505,900 |
| 2015 | $11,399 | $939,000 | $450,200 | $488,800 |
| 2014 | $11,783 | $930,700 | $431,200 | $499,500 |
Source: Public Records
Map
Nearby Homes
- 94 Johnson Rd
- 1 Plymouth Rd
- 12 Cox Rd
- 8 Hawthorne Rd
- 37 Mayflower Rd
- 105 Thornberry Rd
- 20 Amberwood Dr
- 2 Atherton Rd
- 276 High St
- 9 Albamont Rd
- 14 Nassau Dr
- 15 Gershon Way Unit 15
- 40 Foxcroft Rd
- 281 Forest St
- 38 Waltham St
- 312 Washington St
- 74 Wedgemere Ave
- 13 Paddock Ln Unit 13
- 273 Cambridge Rd Unit 508
- 28 Tyler Rd
Your Personal Tour Guide
Ask me questions while you tour the home.