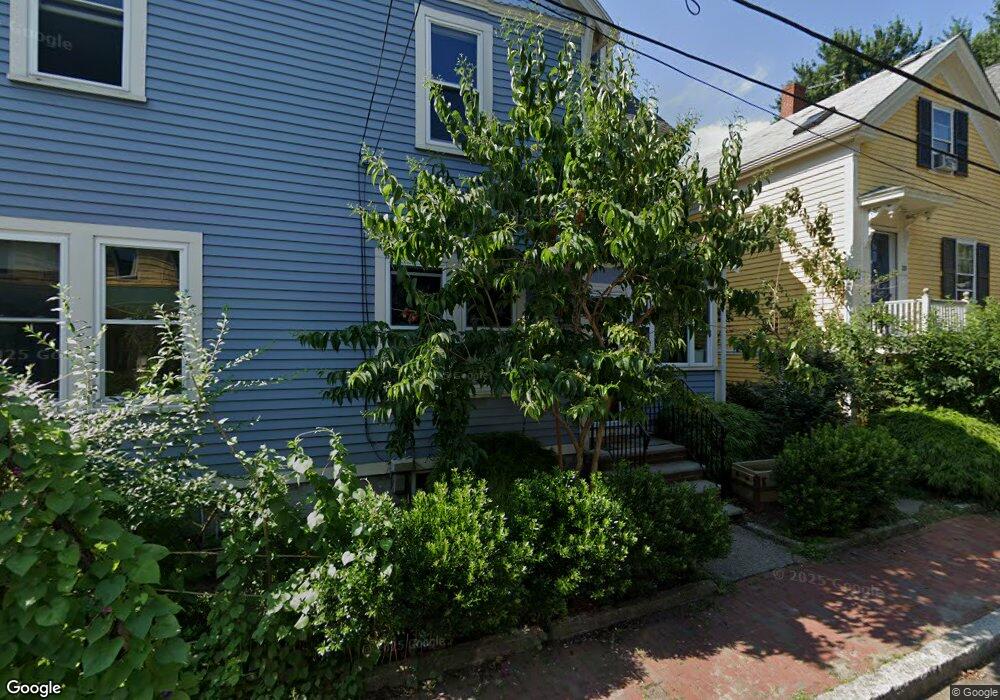
30 Crescent St Unit 30 Cambridge, MA 02138
Baldwin NeighborhoodEstimated Value: $1,527,000 - $1,956,293
3
Beds
2
Baths
1,418
Sq Ft
$1,253/Sq Ft
Est. Value
About This Home
This home is located at 30 Crescent St Unit 30, Cambridge, MA 02138 and is currently estimated at $1,776,823, approximately $1,253 per square foot. 30 Crescent St Unit 30 is a home located in Middlesex County with nearby schools including Saint Theresa School, St Peter School, and Cambridge Montessori School.
Ownership History
Date
Name
Owned For
Owner Type
Purchase Details
Closed on
Feb 17, 2023
Sold by
Rogers Dana R and Borden William
Bought by
Rogers Dana R and Borden William
Current Estimated Value
Purchase Details
Closed on
Apr 25, 2019
Sold by
Rogers Todd and Ross-Rogers Dana
Bought by
Ross-Rogers Dana
Purchase Details
Closed on
Jun 28, 2006
Sold by
Mcmullen James C and Mcmullen Joan B
Bought by
Zelnick Jennifer R and Odonnell Max R
Home Financials for this Owner
Home Financials are based on the most recent Mortgage that was taken out on this home.
Original Mortgage
$488,000
Interest Rate
6.58%
Mortgage Type
Purchase Money Mortgage
Purchase Details
Closed on
Feb 1, 1991
Sold by
Mcmullen David B
Bought by
Mcmullen James C and Mcmullen Joan B
Create a Home Valuation Report for This Property
The Home Valuation Report is an in-depth analysis detailing your home's value as well as a comparison with similar homes in the area
Home Values in the Area
Average Home Value in this Area
Purchase History
| Date | Buyer | Sale Price | Title Company |
|---|---|---|---|
| Rogers Dana R | -- | None Available | |
| Ross-Rogers Dana | -- | -- | |
| Zelnick Jennifer R | $610,000 | -- | |
| Mcmullen James C | $220,000 | -- |
Source: Public Records
Mortgage History
| Date | Status | Borrower | Loan Amount |
|---|---|---|---|
| Previous Owner | Mcmullen James C | $465,000 | |
| Previous Owner | Zelnick Jennifer R | $488,000 | |
| Previous Owner | Mcmullen James C | $35,000 | |
| Previous Owner | Mcmullen James C | $138,000 |
Source: Public Records
Tax History Compared to Growth
Tax History
| Year | Tax Paid | Tax Assessment Tax Assessment Total Assessment is a certain percentage of the fair market value that is determined by local assessors to be the total taxable value of land and additions on the property. | Land | Improvement |
|---|---|---|---|---|
| 2025 | $11,643 | $1,833,500 | $714,500 | $1,119,000 |
| 2024 | $9,979 | $1,685,600 | $784,300 | $901,300 |
| 2023 | $8,996 | $1,535,100 | $779,300 | $755,800 |
| 2022 | $8,881 | $1,500,100 | $830,800 | $669,300 |
| 2021 | $8,550 | $1,461,600 | $830,800 | $630,800 |
| 2020 | $8,075 | $1,404,400 | $806,400 | $598,000 |
| 2019 | $7,412 | $1,247,800 | $695,000 | $552,800 |
| 2018 | $5,267 | $1,154,900 | $627,200 | $527,700 |
| 2017 | $6,945 | $1,070,100 | $576,300 | $493,800 |
| 2016 | $6,642 | $950,200 | $498,900 | $451,300 |
| 2015 | $6,566 | $839,700 | $435,900 | $403,800 |
| 2014 | $5,106 | $609,300 | $406,800 | $202,500 |
Source: Public Records
Map
Nearby Homes
- 74 Oxford St
- 74 Oxford St Unit 3
- 72 Oxford St
- 55 Museum St
- 55 Museum St Unit 55
- 8 Craigie St
- 37 Mellen St
- 15-15A Forest St
- 35 Mellen St
- 31-33 Mellen St
- 22 Lowell St Unit 3
- 35 Ibbetson St
- 749 Somerville Ave Unit 1
- 13 Mellen St Unit Front
- 13 Mellen St
- 1783 Massachusetts Ave Unit B
- 18 Spring St Unit 18A
- 12 Mossland St
- 14 Mossland St
- 42 Belmont St
- 30 Crescent St
- 30 Crescent St Unit 1
- 32 Crescent St
- 28 Crescent St
- 24 Crescent St
- 24 Crescent St Unit 1
- 49 1/2 Sacramento St
- 38 Crescent St
- 35 Crescent St
- 47 Sacramento St Unit 3
- 47 Sacramento St Unit 2
- 47 Sacramento St Unit 1
- 47 Sacramento St
- 49 Sacramento St Unit 2
- 49 Sacramento St Unit 2A
- 49 Sacramento St Unit 1
- 53 Sacramento St Unit 2
- 53 Sacramento St Unit 1
- 51 Sacramento St
- 53 Sacramento St Unit 53