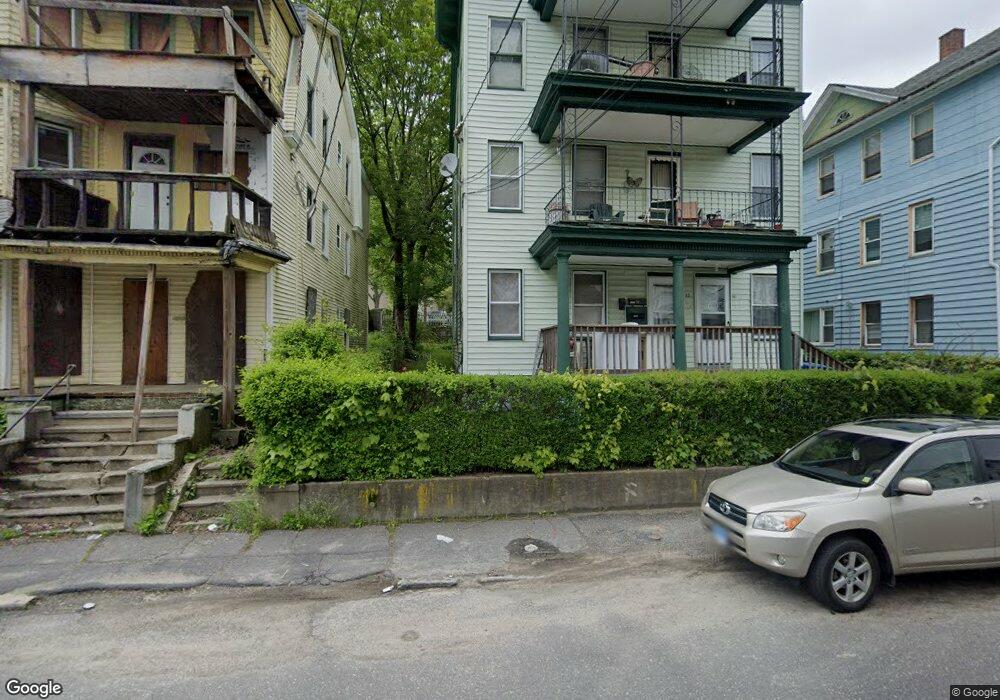
30 Crown St Waterbury, CT 06704
North End District NeighborhoodEstimated Value: $126,000 - $207,000
6
Beds
3
Baths
3,240
Sq Ft
$47/Sq Ft
Est. Value
About This Home
This home is located at 30 Crown St, Waterbury, CT 06704 and is currently estimated at $153,333, approximately $47 per square foot. 30 Crown St is a home located in New Haven County with nearby schools including F. J. Kingsbury School, North End Middle School, and Wilby High School.
Ownership History
Date
Name
Owned For
Owner Type
Purchase Details
Closed on
Jan 8, 2025
Sold by
Paulema Acqui Grp Llc
Bought by
Wa Investment Prop Llc
Current Estimated Value
Purchase Details
Closed on
Feb 22, 2021
Sold by
Levett Latanya and Levett Jalisa
Bought by
172 109Th Ave Llc
Create a Home Valuation Report for This Property
The Home Valuation Report is an in-depth analysis detailing your home's value as well as a comparison with similar homes in the area
Home Values in the Area
Average Home Value in this Area
Purchase History
| Date | Buyer | Sale Price | Title Company |
|---|---|---|---|
| Wa Investment Prop Llc | $120,000 | None Available | |
| Wa Investment Prop Llc | $120,000 | None Available | |
| Paulema Acqui Grp Llc | -- | None Available | |
| Paulema Acqui Grp Llc | -- | None Available | |
| 172 109Th Ave Llc | $45,000 | None Available | |
| 172 109Th Ave Llc | $45,000 | None Available |
Source: Public Records
Tax History Compared to Growth
Tax History
| Year | Tax Paid | Tax Assessment Tax Assessment Total Assessment is a certain percentage of the fair market value that is determined by local assessors to be the total taxable value of land and additions on the property. | Land | Improvement |
|---|---|---|---|---|
| 2025 | $4,628 | $102,900 | $10,290 | $92,610 |
| 2024 | $5,087 | $102,900 | $10,290 | $92,610 |
| 2023 | $5,576 | $102,900 | $10,290 | $92,610 |
| 2022 | $2,411 | $40,050 | $10,290 | $29,760 |
| 2021 | $2,411 | $40,050 | $10,290 | $29,760 |
| 2020 | $2,411 | $40,050 | $10,290 | $29,760 |
| 2019 | $2,411 | $40,050 | $10,290 | $29,760 |
| 2018 | $2,411 | $40,050 | $10,290 | $29,760 |
| 2017 | $2,391 | $39,710 | $10,290 | $29,420 |
| 2016 | $2,391 | $39,710 | $10,290 | $29,420 |
| 2015 | $2,312 | $39,710 | $10,290 | $29,420 |
| 2014 | $2,312 | $39,710 | $10,290 | $29,420 |
Source: Public Records
Map
Nearby Homes