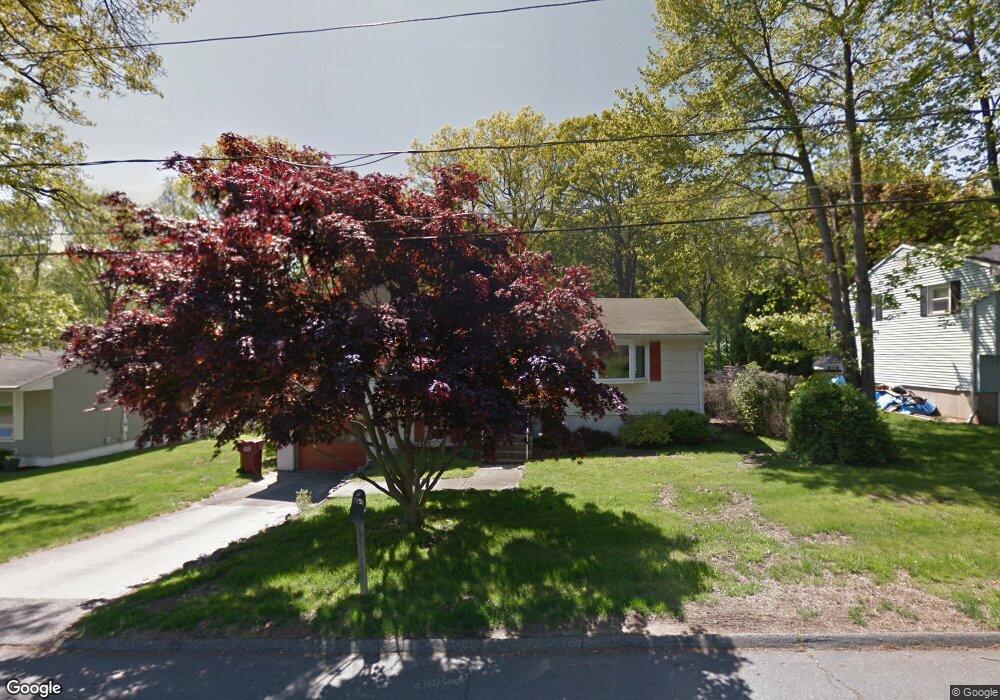
30 Debbie Ln Naugatuck, CT 06770
Estimated Value: $350,000 - $394,000
3
Beds
1
Bath
1,252
Sq Ft
$294/Sq Ft
Est. Value
About This Home
This home is located at 30 Debbie Ln, Naugatuck, CT 06770 and is currently estimated at $368,587, approximately $294 per square foot. 30 Debbie Ln is a home located in New Haven County with nearby schools including City Hill Middle School and Naugatuck High School.
Ownership History
Date
Name
Owned For
Owner Type
Purchase Details
Closed on
Sep 6, 2022
Sold by
Chouinard Normand D and Chouinard Elaine F
Bought by
N D & E F Chouinard Ft and Chouinard
Current Estimated Value
Purchase Details
Closed on
Jan 28, 1999
Sold by
Jones Ruth
Bought by
Chouinard Normand and Chouinard Elaine
Create a Home Valuation Report for This Property
The Home Valuation Report is an in-depth analysis detailing your home's value as well as a comparison with similar homes in the area
Home Values in the Area
Average Home Value in this Area
Purchase History
| Date | Buyer | Sale Price | Title Company |
|---|---|---|---|
| N D & E F Chouinard Ft | -- | None Available | |
| Chouinard Normand | $125,500 | -- |
Source: Public Records
Mortgage History
| Date | Status | Borrower | Loan Amount |
|---|---|---|---|
| Previous Owner | Chouinard Normand | $50,000 | |
| Previous Owner | Chouinard Normand | $25,000 | |
| Previous Owner | Chouinard Normand | $90,000 | |
| Previous Owner | Chouinard Normand | $100,000 |
Source: Public Records
Tax History
| Year | Tax Paid | Tax Assessment Tax Assessment Total Assessment is a certain percentage of the fair market value that is determined by local assessors to be the total taxable value of land and additions on the property. | Land | Improvement |
|---|---|---|---|---|
| 2025 | $6,710 | $168,630 | $32,900 | $135,730 |
| 2024 | $7,047 | $168,630 | $32,900 | $135,730 |
| 2023 | $7,546 | $168,630 | $32,900 | $135,730 |
| 2022 | $5,464 | $114,420 | $34,790 | $79,630 |
| 2021 | $5,464 | $114,420 | $34,790 | $79,630 |
| 2020 | $5,464 | $114,420 | $34,790 | $79,630 |
| 2019 | $5,406 | $114,420 | $34,790 | $79,630 |
| 2018 | $5,264 | $108,870 | $44,490 | $64,380 |
| 2017 | $5,286 | $108,870 | $44,490 | $64,380 |
| 2016 | $5,190 | $108,870 | $44,490 | $64,380 |
| 2015 | $4,961 | $108,870 | $44,490 | $64,380 |
| 2014 | $4,906 | $108,870 | $44,490 | $64,380 |
| 2012 | $5,188 | $154,620 | $53,080 | $101,540 |
Source: Public Records
Map
Nearby Homes
- 18 Olivia Ln
- 35 Monahan Ln
- 171 Union City Rd
- 22 Crestwood Dr
- 125 Salem Rd
- 25 Tyler Hill Rd
- 147 Sprucedale Dr
- 85 Cold Spring Cir
- 111 Wooster St Unit 4A
- 24 Rozum Cir
- 36 Longview Terrace
- 51 Brook St Unit 6A
- 51 Brook St Unit 3B
- 22 Neagle St
- 6 Laura Ave
- 20 Alpine Ave
- 32 Stanley St
- 119 Prospect St
- 66 Union City Rd
- 163 City Hill St
Your Personal Tour Guide
Ask me questions while you tour the home.