Estimated Value: $248,733 - $313,000
Studio
--
Bath
1,788
Sq Ft
$159/Sq Ft
Est. Value
About This Home
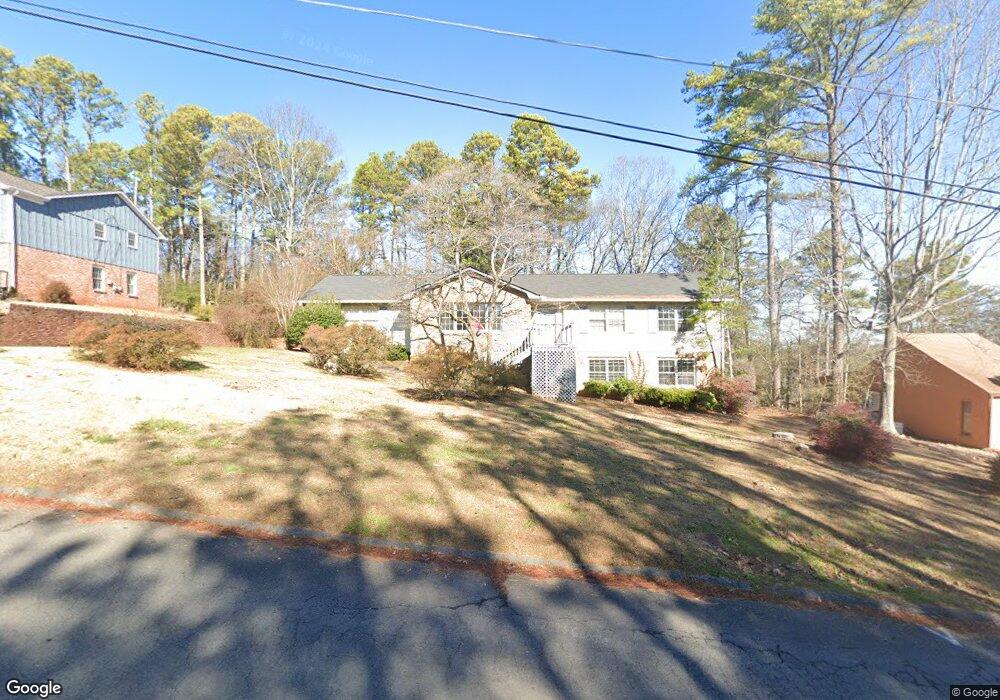
This home is located at 30 Devonshire Dr SE, Rome, GA 30161 and is currently estimated at $283,683, approximately $158 per square foot. 30 Devonshire Dr SE is a home located in Floyd County with nearby schools including Pepperell Middle School, Pepperell High School, and Montessori School of Rome.
Ownership History
Date
Name
Owned For
Owner Type
Purchase Details
Closed on
Sep 6, 2005
Sold by
Jones Wanda Diamond
Bought by
Jones Harold Wayne and Jones Leslie M
Current Estimated Value
Purchase Details
Closed on
Mar 24, 1993
Sold by
Lisi Kathleen M
Bought by
Jones Harold Wayne and Wanda Diamond
Purchase Details
Closed on
Jun 29, 1990
Sold by
Seymour John W and Seymour Mary F
Bought by
Lisi Kathleen M
Purchase Details
Closed on
Aug 8, 1988
Bought by
P and R
Purchase Details
Closed on
Aug 1, 1988
Sold by
Sargent R Richard
Bought by
Seymour John W and Seymour Mary F
Purchase Details
Closed on
Aug 14, 1981
Sold by
Duffey Terry F
Bought by
Sargent R Richard
Purchase Details
Closed on
Nov 28, 1978
Sold by
Custom Home Builders Inc
Bought by
Duffey Terry F
Purchase Details
Closed on
Apr 28, 1978
Sold by
N R S Properties Inc
Bought by
Custom Home Builders Inc
Purchase Details
Closed on
Jun 12, 1975
Bought by
N R S Properties Inc
Create a Home Valuation Report for This Property
The Home Valuation Report is an in-depth analysis detailing your home's value as well as a comparison with similar homes in the area
Home Values in the Area
Average Home Value in this Area
Purchase History
| Date | Buyer | Sale Price | Title Company |
|---|---|---|---|
| Jones Harold Wayne | -- | -- | |
| Jones Harold Wayne | $87,000 | -- | |
| Lisi Kathleen M | $86,000 | -- | |
| P | -- | -- | |
| Seymour John W | $76,000 | -- | |
| Sargent R Richard | $60,000 | -- | |
| Duffey Terry F | $54,000 | -- | |
| Custom Home Builders Inc | $5,000 | -- | |
| N R S Properties Inc | -- | -- |
Source: Public Records
Tax History
| Year | Tax Paid | Tax Assessment Tax Assessment Total Assessment is a certain percentage of the fair market value that is determined by local assessors to be the total taxable value of land and additions on the property. | Land | Improvement |
|---|---|---|---|---|
| 2025 | $2,100 | $91,769 | $10,169 | $81,600 |
| 2024 | $2,100 | $95,705 | $9,245 | $86,460 |
| 2023 | $2,181 | $88,510 | $8,218 | $80,292 |
| 2022 | $1,891 | $74,677 | $6,677 | $68,000 |
| 2021 | $1,803 | $68,349 | $6,163 | $62,186 |
| 2020 | $1,673 | $60,733 | $4,879 | $55,854 |
| 2019 | $1,539 | $54,585 | $4,879 | $49,706 |
| 2018 | $1,495 | $52,186 | $4,879 | $47,307 |
| 2017 | $1,446 | $49,343 | $4,879 | $44,464 |
| 2016 | $1,453 | $48,760 | $4,840 | $43,920 |
| 2015 | -- | $52,332 | $4,840 | $47,492 |
| 2014 | -- | $52,332 | $4,840 | $47,492 |
Source: Public Records
Map
Nearby Homes
- 0 Warwick Way SE Unit 7719877
- 0 Warwick Way SE Unit 10692183
- 0 Warwick Way SE Unit 10624495
- 0 Warwick Way SE Unit 7666193
- 11 Cambridge Dr SE
- 85 Cambridge Dr SE
- 10 Warwick Way SE
- 102 Margo Trail SE
- 0 Wellington Way SE Unit 10693561
- 0 Wellington Way SE Unit 7721620
- 0 Wellington Way SE Unit 7721621
- 0 Wellington Way SE Unit 10693583
- 9 Wellington Way SE
- 111 Warwick Way SE
- 0 Twickenham Rd SE Unit 10707322
- 0 Twickenham Rd SE Unit 7732642
- 113 Warwick Way SE
- 18 Wellington Way SE
- 0 Camelot Cir SE Unit 7662985
- 0 Camelot Cir SE Unit 10621392
- 32 Devonshire Dr SE
- 28 Devonshire Dr SE
- 12 Devonshire Dr SE
- 34 Devonshire Dr SE
- 26 Devonshire Dr SE
- 25 Devonshire Dr SE
- 1 Canterbury Ct SE
- 24 Devonshire Dr SE
- 4 Canterbury Ct SE
- 3 Canterbury Ct SE
- 1 Downing St SE
- 21 Devonshire Dr SE Unit 56
- 21 Devonshire Dr SE
- 40 Devonshire Dr SE
- 3 Downing St SE
- 4 Dover Dr SE
- 22 Devonshire Dr SE
- 42 Devonshire Dr SE
- 5 Canterbury Ct SE
- 6 Canterbury Ct SE
Your Personal Tour Guide
Ask me questions while you tour the home.