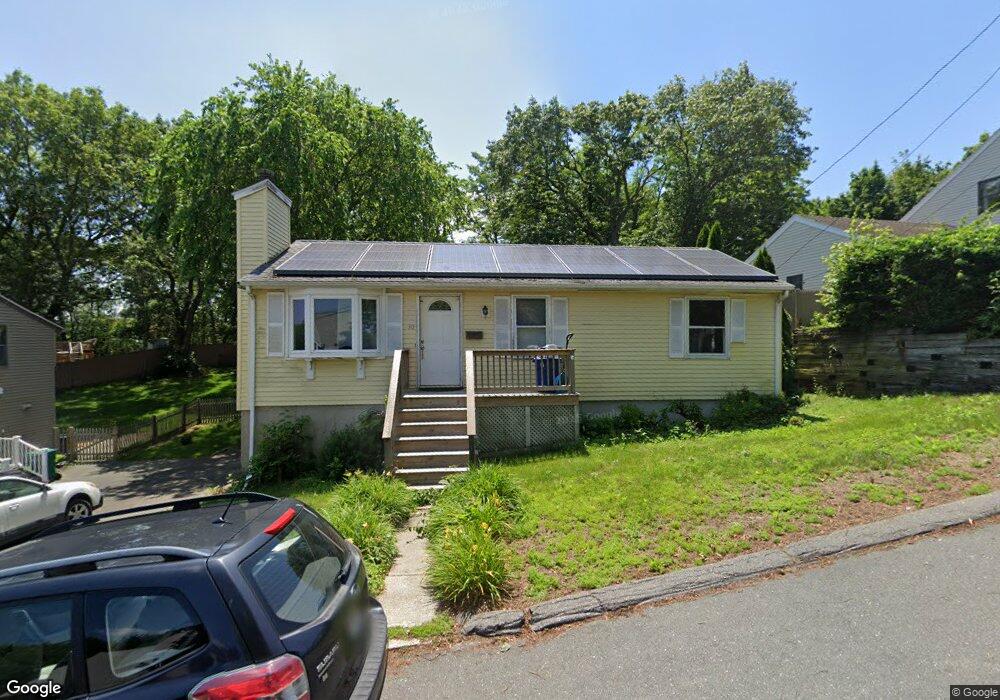
30 Dibble Rd Lynn, MA 01904
Fays Estate NeighborhoodEstimated Value: $566,000 - $756,000
2
Beds
2
Baths
960
Sq Ft
$687/Sq Ft
Est. Value
About This Home
This home is located at 30 Dibble Rd, Lynn, MA 01904 and is currently estimated at $659,704, approximately $687 per square foot. 30 Dibble Rd is a home located in Essex County with nearby schools including Aborn Elementary School, William R. Fallon School, and Pickering Middle School.
Ownership History
Date
Name
Owned For
Owner Type
Purchase Details
Closed on
Jun 2, 2004
Sold by
Smith Gerald R
Bought by
Grace Michelle
Current Estimated Value
Purchase Details
Closed on
Jun 26, 1998
Sold by
Ciafardoni Scott and Ciafardoni Dawn
Bought by
Smith Gerald R and Smith Christine D
Purchase Details
Closed on
Mar 31, 1995
Sold by
Fnma
Bought by
Ciafardoni Scott and Ciafardoni Dawn
Purchase Details
Closed on
Jul 14, 1994
Sold by
Dinicola Donald
Bought by
Federal National Mortgage Association
Create a Home Valuation Report for This Property
The Home Valuation Report is an in-depth analysis detailing your home's value as well as a comparison with similar homes in the area
Home Values in the Area
Average Home Value in this Area
Purchase History
| Date | Buyer | Sale Price | Title Company |
|---|---|---|---|
| Grace Michelle | $298,900 | -- | |
| Smith Gerald R | $139,000 | -- | |
| Ciafardoni Scott | $113,500 | -- | |
| Federal National Mortgage Association | $103,200 | -- |
Source: Public Records
Mortgage History
| Date | Status | Borrower | Loan Amount |
|---|---|---|---|
| Open | Federal National Mortgage Association | $237,900 |
Source: Public Records
Tax History
| Year | Tax Paid | Tax Assessment Tax Assessment Total Assessment is a certain percentage of the fair market value that is determined by local assessors to be the total taxable value of land and additions on the property. | Land | Improvement |
|---|---|---|---|---|
| 2025 | $5,486 | $529,500 | $201,900 | $327,600 |
| 2024 | $5,383 | $511,200 | $193,600 | $317,600 |
| 2023 | $5,193 | $465,700 | $183,900 | $281,800 |
| 2022 | $4,981 | $400,700 | $152,900 | $247,800 |
| 2021 | $4,757 | $365,100 | $138,800 | $226,300 |
| 2020 | $4,837 | $361,000 | $141,900 | $219,100 |
| 2019 | $4,822 | $337,200 | $135,300 | $201,900 |
| 2018 | $4,672 | $308,400 | $132,300 | $176,100 |
| 2017 | $4,579 | $293,500 | $117,800 | $175,700 |
| 2016 | $4,242 | $262,200 | $101,600 | $160,600 |
| 2015 | $4,050 | $241,800 | $100,300 | $141,500 |
Source: Public Records
Map
Nearby Homes
- 38 Ledgemont Ln
- 31 Atkins Ave
- 73 Lockwood Rd
- 19 Gage St
- 11 Urban St
- 431-433 Chatham St
- 27-29 Graves Ave
- 6A Goodridge St
- 91 Oakwood Ave
- 100 Magnolia Ave Unit 5
- 21 E Park Ave
- 18 Kittredge St
- 10 Pond St
- 16 Clinton St
- 2 Chestnut Terrace
- 10 Fairview Rd
- 1 Clough St
- 354 Broadway Unit 3
- 50 Webster St
- 40 Archer St
Your Personal Tour Guide
Ask me questions while you tour the home.