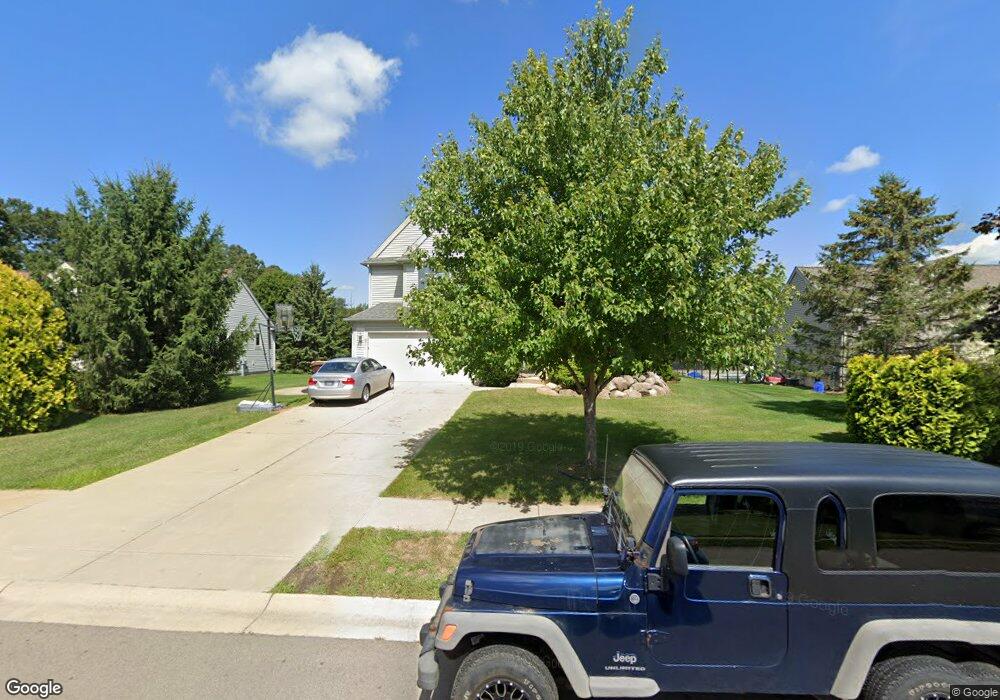
30 Dickens Rd Unit 11 Spring Arbor, MI 49283
Estimated Value: $360,172 - $393,000
3
Beds
2
Baths
1,792
Sq Ft
$211/Sq Ft
Est. Value
About This Home
This home is located at 30 Dickens Rd Unit 11, Spring Arbor, MI 49283 and is currently estimated at $377,793, approximately $210 per square foot. 30 Dickens Rd Unit 11 is a home located in Jackson County with nearby schools including Western High School.
Ownership History
Date
Name
Owned For
Owner Type
Purchase Details
Closed on
Sep 30, 2021
Sold by
Potter Gary Matthew and Potter Gary
Bought by
Rick Steven and Rick Mary
Current Estimated Value
Home Financials for this Owner
Home Financials are based on the most recent Mortgage that was taken out on this home.
Original Mortgage
$135,000
Outstanding Balance
$114,150
Interest Rate
2.8%
Mortgage Type
New Conventional
Estimated Equity
$263,643
Purchase Details
Closed on
Feb 23, 2004
Sold by
Belote Homes Inc
Bought by
Potter Gary Matthew and Potter Heather L
Home Financials for this Owner
Home Financials are based on the most recent Mortgage that was taken out on this home.
Original Mortgage
$190,600
Interest Rate
4%
Mortgage Type
Purchase Money Mortgage
Purchase Details
Closed on
Apr 25, 2003
Sold by
4 Friends Development Llc
Bought by
Belote Homes Inc
Create a Home Valuation Report for This Property
The Home Valuation Report is an in-depth analysis detailing your home's value as well as a comparison with similar homes in the area
Home Values in the Area
Average Home Value in this Area
Purchase History
| Date | Buyer | Sale Price | Title Company |
|---|---|---|---|
| Rick Steven | $287,500 | American Title | |
| Potter Gary Matthew | $217,875 | -- | |
| Belote Homes Inc | -- | -- |
Source: Public Records
Mortgage History
| Date | Status | Borrower | Loan Amount |
|---|---|---|---|
| Open | Rick Steven | $135,000 | |
| Previous Owner | Potter Gary Matthew | $190,600 |
Source: Public Records
Tax History
| Year | Tax Paid | Tax Assessment Tax Assessment Total Assessment is a certain percentage of the fair market value that is determined by local assessors to be the total taxable value of land and additions on the property. | Land | Improvement |
|---|---|---|---|---|
| 2025 | $6,567 | $168,800 | $0 | $0 |
| 2024 | $39 | $171,800 | $0 | $0 |
| 2023 | $3,877 | $163,000 | $0 | $0 |
| 2022 | $6,263 | $163,100 | $0 | $0 |
| 2021 | $4,136 | $153,890 | $0 | $0 |
| 2020 | $4,466 | $146,990 | $0 | $0 |
| 2019 | $3,849 | $135,400 | $0 | $0 |
| 2018 | $3,848 | $121,050 | $15,080 | $105,970 |
| 2017 | $3,719 | $121,420 | $0 | $0 |
| 2016 | $2,296 | $120,710 | $120,710 | $0 |
| 2015 | $94,345 | $110,350 | $110,350 | $0 |
| 2014 | $94,345 | $99,140 | $0 | $0 |
| 2013 | -- | $99,140 | $99,140 | $0 |
Source: Public Records
Map
Nearby Homes
- 68 Dickens St
- 7315 King Rd
- 7969 Brandon Dr
- 2635 S Dearing Rd
- 2625 S Dearing Rd
- 2503 Milford Rd
- V/L S Dearing Rd Unit 40 Acres Vacant Land
- 1400 Chapel Rd
- 1400 Chapel Rd Unit B
- 1400 Chapel Rd Unit A
- 6728 King Rd
- 1570 Chapel Rd
- 0 S Parma Rd Unit 26002151
- 0 S Parma Rd Unit 26002152
- 1126 Chapel Rd
- 7870 Sears Rd
- 20 AC VL Sears Rd
- 5454 Vrooman Rd
- 5427 Vrooman Rd
- 6820 Bowerman Rd
- 30 Dickens St
- 32 Dickens St Unit 12
- 32 Dickens St
- 32 Dickens Rd
- 28 Dickens Rd Unit 10
- 26 Dickens Rd Unit 9
- 34 Dickens Rd Unit 13
- 29 Dickens St
- 36 Dickens St Unit 14
- 36 Dickens St
- 36 Dickens Rd Unit 14
- 24 Dickens Rd Unit 8
- 33 Dickens St
- 31 Dickens Rd Unit 29
- 29 Dickens Rd Unit 30
- 33 Dickens Rd Unit 28
- 27 Dickens Rd Unit 31
- 25 Dickens St
- 38 Dickens Rd Unit 15
- 22 Dickens Rd Unit 7
Your Personal Tour Guide
Ask me questions while you tour the home.