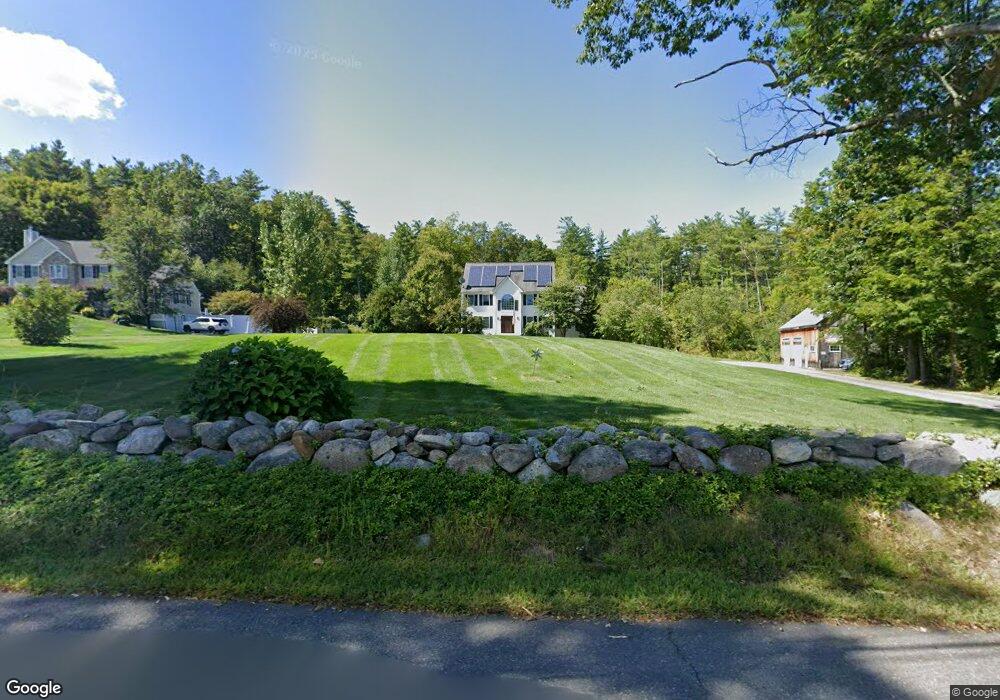
30 Dow St Unit 32 Pepperell, MA 01463
Estimated Value: $702,000 - $810,000
4
Beds
3
Baths
2,530
Sq Ft
$305/Sq Ft
Est. Value
About This Home
This home is located at 30 Dow St Unit 32, Pepperell, MA 01463 and is currently estimated at $772,180, approximately $305 per square foot. 30 Dow St Unit 32 is a home located in Middlesex County with nearby schools including North Middlesex Regional High School, Pepperell Christian Academy, and Maple Dene & Moppet School.
Ownership History
Date
Name
Owned For
Owner Type
Purchase Details
Closed on
Nov 10, 2000
Sold by
Twin Valley Homes Inc
Bought by
Anthony Robin C and Aminti Lionel J
Current Estimated Value
Home Financials for this Owner
Home Financials are based on the most recent Mortgage that was taken out on this home.
Original Mortgage
$298,260
Outstanding Balance
$109,354
Interest Rate
7.81%
Mortgage Type
Purchase Money Mortgage
Estimated Equity
$662,826
Create a Home Valuation Report for This Property
The Home Valuation Report is an in-depth analysis detailing your home's value as well as a comparison with similar homes in the area
Home Values in the Area
Average Home Value in this Area
Purchase History
| Date | Buyer | Sale Price | Title Company |
|---|---|---|---|
| Anthony Robin C | $331,400 | -- |
Source: Public Records
Mortgage History
| Date | Status | Borrower | Loan Amount |
|---|---|---|---|
| Open | Anthony Robin C | $298,260 |
Source: Public Records
Tax History Compared to Growth
Tax History
| Year | Tax Paid | Tax Assessment Tax Assessment Total Assessment is a certain percentage of the fair market value that is determined by local assessors to be the total taxable value of land and additions on the property. | Land | Improvement |
|---|---|---|---|---|
| 2025 | $10,797 | $738,000 | $200,500 | $537,500 |
| 2024 | $9,942 | $692,800 | $184,100 | $508,700 |
| 2023 | $9,447 | $624,000 | $144,100 | $479,900 |
| 2022 | $9,438 | $550,300 | $131,300 | $419,000 |
| 2021 | $9,202 | $513,500 | $115,300 | $398,200 |
| 2020 | $8,458 | $498,100 | $115,300 | $382,800 |
| 2019 | $7,598 | $458,000 | $115,300 | $342,700 |
| 2018 | $6,879 | $419,700 | $115,300 | $304,400 |
| 2017 | $6,629 | $417,200 | $115,300 | $301,900 |
| 2016 | $6,448 | $390,100 | $115,300 | $274,800 |
| 2015 | $6,350 | $398,100 | $123,300 | $274,800 |
| 2014 | $6,111 | $385,300 | $115,300 | $270,000 |
Source: Public Records
Map
Nearby Homes