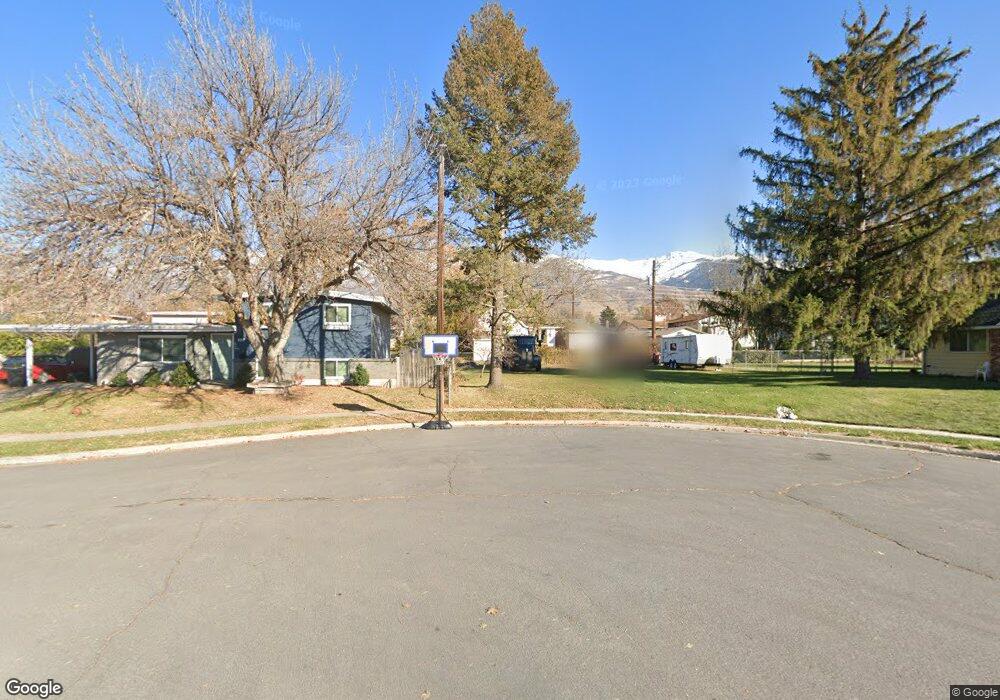
30 E 400 N Kaysville, UT 84037
Estimated Value: $474,000 - $617,000
4
Beds
2
Baths
1,761
Sq Ft
$306/Sq Ft
Est. Value
About This Home
This home is located at 30 E 400 N, Kaysville, UT 84037 and is currently estimated at $539,286, approximately $306 per square foot. 30 E 400 N is a home located in Davis County with nearby schools including Kaysville Elementary School, Kaysville Junior High School, and Davis High School.
Ownership History
Date
Name
Owned For
Owner Type
Purchase Details
Closed on
Feb 17, 2026
Sold by
Sweeten Gladys L and Family Trust Agreement Of Gladys L Moore
Bought by
Family Trust and Sweeten
Current Estimated Value
Home Financials for this Owner
Home Financials are based on the most recent Mortgage that was taken out on this home.
Original Mortgage
$185,000
Outstanding Balance
$185,000
Interest Rate
5.46%
Mortgage Type
New Conventional
Estimated Equity
$354,286
Purchase Details
Closed on
Jan 29, 2026
Sold by
Moore Gladys L and Gladys L Moore Family Trust
Bought by
Gladys L Sweeten Family Trust and Sweeten
Home Financials for this Owner
Home Financials are based on the most recent Mortgage that was taken out on this home.
Original Mortgage
$185,000
Outstanding Balance
$185,000
Interest Rate
5.46%
Mortgage Type
New Conventional
Estimated Equity
$354,286
Purchase Details
Closed on
Jan 9, 2023
Sold by
Moore Gladys L
Bought by
Family Trust
Purchase Details
Closed on
Oct 21, 2002
Sold by
Moore David Brad
Bought by
Graham Gladys L
Purchase Details
Closed on
Nov 16, 2000
Sold by
Graham Gladys L
Bought by
Graham Gladys L and The David Brad Moore & Gladys L Graham T
Home Financials for this Owner
Home Financials are based on the most recent Mortgage that was taken out on this home.
Original Mortgage
$80,000
Interest Rate
7.82%
Purchase Details
Closed on
Nov 1, 2000
Sold by
Graham Gladys L
Bought by
Graham Gladys L
Home Financials for this Owner
Home Financials are based on the most recent Mortgage that was taken out on this home.
Original Mortgage
$80,000
Interest Rate
7.82%
Purchase Details
Closed on
Jan 28, 1997
Sold by
Graham Gladys L
Bought by
Graham Gladys L and David Brad Moore & Gladys L Graham Trust
Create a Home Valuation Report for This Property
The Home Valuation Report is an in-depth analysis detailing your home's value as well as a comparison with similar homes in the area
Home Values in the Area
Average Home Value in this Area
Purchase History
| Date | Buyer | Sale Price | Title Company |
|---|---|---|---|
| Family Trust | -- | First American Title Insurance | |
| Gladys L Sweeten Family Trust | -- | None Listed On Document | |
| Family Trust | -- | -- | |
| Moore Gladys L | -- | -- | |
| Graham Gladys L | -- | -- | |
| Graham Gladys L | -- | Bonneville Title Company Inc | |
| Graham Gladys L | -- | Bonneville Title Company Inc | |
| Graham Gladys L | -- | Bonneville Title Company Inc | |
| Graham Gladys L | -- | Bonneville Title Company Inc | |
| Graham Gladys L | -- | -- |
Source: Public Records
Mortgage History
| Date | Status | Borrower | Loan Amount |
|---|---|---|---|
| Open | Family Trust | $185,000 | |
| Previous Owner | Graham Gladys L | $80,000 |
Source: Public Records
Tax History
| Year | Tax Paid | Tax Assessment Tax Assessment Total Assessment is a certain percentage of the fair market value that is determined by local assessors to be the total taxable value of land and additions on the property. | Land | Improvement |
|---|---|---|---|---|
| 2025 | $249 | $295,350 | $173,154 | $122,196 |
| 2024 | $2,702 | $284,900 | $139,998 | $144,902 |
| 2023 | $2,667 | $498,000 | $242,588 | $255,412 |
| 2022 | $2,719 | $284,900 | $130,619 | $154,281 |
| 2021 | $2,471 | $388,000 | $178,421 | $209,579 |
| 2020 | $1,864 | $285,000 | $148,798 | $136,202 |
| 2019 | $1,845 | $277,000 | $166,546 | $110,454 |
| 2018 | $1,677 | $251,000 | $145,933 | $105,067 |
| 2016 | $1,475 | $116,050 | $35,864 | $80,186 |
| 2015 | $1,421 | $106,150 | $35,864 | $70,286 |
| 2014 | $1,436 | $109,221 | $35,864 | $73,357 |
| 2013 | -- | $90,570 | $20,013 | $70,557 |
Source: Public Records
Map
Nearby Homes
- 400 N 30 E
- 97 E Crestwood Rd
- 481 N 150 E
- 150 E 600 N Unit 5
- 150 E 600 N Unit 18
- 285 E 500 N Unit 102
- 281 W 300 N
- 420 N Main St Unit 22
- 290 W 100 N
- 80 E Center St
- 425 E 500 N
- 285 W Center St
- 524 Hyde Park Ln
- 1328 E Orchard Ridge Ln
- 766 N Stonne Ln
- 141 W Gailey Ln
- 91 S 400 W
- 1236 E 100 S
- 56 Whitaker Cir
- 772 N Crimson Ln
Your Personal Tour Guide
Ask me questions while you tour the home.