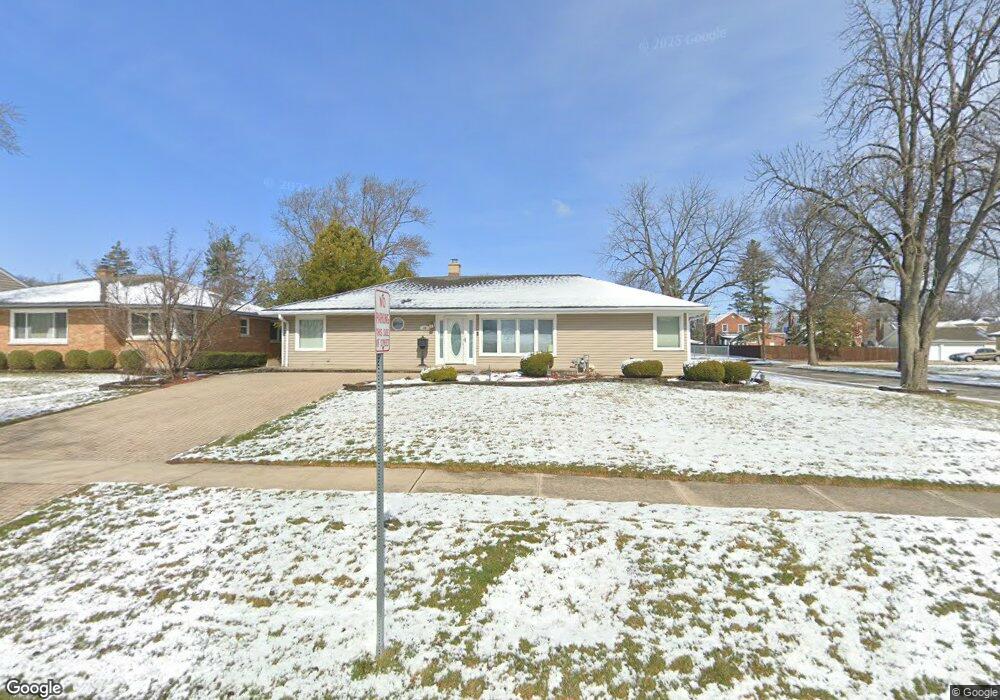
30 E Adams St Villa Park, IL 60181
Estimated Value: $527,000 - $672,000
5
Beds
3
Baths
2,562
Sq Ft
$233/Sq Ft
Est. Value
About This Home
This home is located at 30 E Adams St, Villa Park, IL 60181 and is currently estimated at $595,788, approximately $232 per square foot. 30 E Adams St is a home located in DuPage County with nearby schools including Westmore Elementary School, Jackson Middle School, and Willowbrook High School.
Ownership History
Date
Name
Owned For
Owner Type
Purchase Details
Closed on
Oct 21, 2014
Sold by
Nosal Pufahl Debra J and Pufahl Eric L
Bought by
Nosal Pufahl Debra J and The Debra J Nosal Pufahl Revocable Trust
Current Estimated Value
Purchase Details
Closed on
Apr 15, 2010
Sold by
Bonsonto Joseph G and Bonsonto April
Bought by
Pufahl Eric and Nosal Pufahl Debra J
Home Financials for this Owner
Home Financials are based on the most recent Mortgage that was taken out on this home.
Original Mortgage
$255,000
Outstanding Balance
$169,923
Interest Rate
5.01%
Mortgage Type
New Conventional
Estimated Equity
$425,865
Purchase Details
Closed on
Jun 19, 2000
Sold by
Nutt Steven and Nutt Valerie L
Bought by
Bonsonto Joseph G and Bonsonto April
Home Financials for this Owner
Home Financials are based on the most recent Mortgage that was taken out on this home.
Original Mortgage
$263,125
Interest Rate
8.56%
Mortgage Type
Stand Alone First
Create a Home Valuation Report for This Property
The Home Valuation Report is an in-depth analysis detailing your home's value as well as a comparison with similar homes in the area
Home Values in the Area
Average Home Value in this Area
Purchase History
| Date | Buyer | Sale Price | Title Company |
|---|---|---|---|
| Nosal Pufahl Debra J | -- | None Available | |
| Pufahl Eric | $325,000 | Midwest Title Services Llc | |
| Bonsonto Joseph G | $310,500 | Chicago Title Insurance Co |
Source: Public Records
Mortgage History
| Date | Status | Borrower | Loan Amount |
|---|---|---|---|
| Open | Pufahl Eric | $255,000 | |
| Previous Owner | Bonsonto Joseph G | $263,125 |
Source: Public Records
Tax History Compared to Growth
Tax History
| Year | Tax Paid | Tax Assessment Tax Assessment Total Assessment is a certain percentage of the fair market value that is determined by local assessors to be the total taxable value of land and additions on the property. | Land | Improvement |
|---|---|---|---|---|
| 2024 | $12,888 | $178,518 | $55,087 | $123,431 |
| 2023 | $12,299 | $165,080 | $50,940 | $114,140 |
| 2022 | $11,871 | $158,680 | $48,960 | $109,720 |
| 2021 | $11,394 | $154,730 | $47,740 | $106,990 |
| 2020 | $11,129 | $151,340 | $46,690 | $104,650 |
| 2019 | $10,403 | $143,890 | $44,390 | $99,500 |
| 2018 | $9,743 | $127,300 | $39,270 | $88,030 |
| 2017 | $9,520 | $121,310 | $37,420 | $83,890 |
| 2016 | $9,265 | $114,280 | $35,250 | $79,030 |
| 2015 | $9,152 | $106,470 | $32,840 | $73,630 |
| 2014 | $7,832 | $92,310 | $38,370 | $53,940 |
| 2013 | $7,462 | $93,610 | $38,910 | $54,700 |
Source: Public Records
Map
Nearby Homes
- 2 Ardmore Ave
- 5 E Washington St
- 613 S Summit Ave
- 818 S Villa Ave
- 928 S Michigan Ave
- 604 S Grant Ave
- 835 S Wisconsin Ave
- 326 W Adams St
- 194 Washington St
- 727 S Oakland Ave
- 1150 E Jackson St Unit 1A
- 639 S Oakland Ave
- 412 E Washington St
- 0S639 Summit Ave
- 625 E Van Buren St
- 1500 S Ardmore Ave Unit 408
- 316 E Highland Ave
- 650 E Van Buren St
- 1046 E Van Buren St
- 343 S Wisconsin Ave
- 24 E Adams St
- 20 E Adams St
- 909 S Cornell Ave
- 16 E Adams St
- 27 E Adams St
- 31 E Adams St
- 23 E Adams St
- 19 E Adams St
- 15 E Adams St
- 836 S Cornell Ave
- 21 E Monroe St
- 102 E Adams St
- 19 E Monroe St
- 913 S Ardmore Ave
- 41 E Adams St
- 33 E Monroe St
- 905 S Ardmore Ave
- 15 E Monroe St
- 37 E Monroe St
- 5 E Adams St